|
|
| View previous topic :: View next topic |
| Author |
a layman's approach to break out and break down |
vishytns
White Belt

Joined: 26 Nov 2009
Posts: 206
|
Post: #256  Posted: Sun Nov 14, 2010 6:33 pm Post subject: Posted: Sun Nov 14, 2010 6:33 pm Post subject: |
 |
|
Casper,
You are the best person to provide TOP FIVE stocks.
Vishy.
|
|
| Back to top |
|
 |
|
|  |
casper
Green Belt

Joined: 02 Oct 2010
Posts: 1315
|
Post: #257  Posted: Sun Nov 14, 2010 6:39 pm Post subject: Posted: Sun Nov 14, 2010 6:39 pm Post subject: |
 |
|
hi vishy nice work!!!!
unitech= h/s, target will be 73.
idfc=broadening top. target 182
idbi= i dont think this is a broadening top, at least 3 distinct tops and 2 distinct bottoms are need to qualify, and pattern should form over a long time, here bottoms are relatively flat
reliance= a break down below 1050 will confirm it, target will be 1000
gujnrecoke= h/s ,a break below 58 will confirm the pattern, target will be around 30
ashokeley= yes right again, its broadening top, target will be around 60
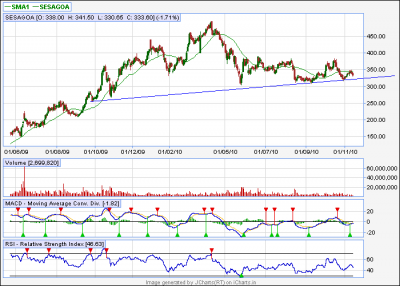
sesa goa= yes going to be a h/s, let us get a break down below 320 plus some filter say around 310, target will be around 150-130. though it will take time and wont break down too fast, and when it will happen,it will be a disaster (bd point will be around 320 not 350, plz see the chart im posting)
| Description: |
|
| Filesize: |
16.75 KB |
| Viewed: |
393 Time(s) |
|
|
|
| Back to top |
|
 |
casper
Green Belt

Joined: 02 Oct 2010
Posts: 1315
|
Post: #258  Posted: Sun Nov 14, 2010 6:50 pm Post subject: Posted: Sun Nov 14, 2010 6:50 pm Post subject: |
 |
|
| vishytns wrote: | Casper,
You are the best person to provide TOP FIVE stocks.
Vishy. |
vishy always let me face and himself slide away by side doors (plz dont mind,just joking)  but this time vishy will also pick best 5 of his choice but this time vishy will also pick best 5 of his choice 
girish bhai, let me go through ongc and other scrips vishy mentioned, then i will try to pick up,
and vishy u start now

|
|
| Back to top |
|
 |
vishytns
White Belt

Joined: 26 Nov 2009
Posts: 206
|
Post: #259  Posted: Sun Nov 14, 2010 7:44 pm Post subject: Posted: Sun Nov 14, 2010 7:44 pm Post subject: |
 |
|
Casper,

My 5 picks include DLF, Bharti, RCOM, ONGC, and ICICIBANK. You should short them only if nifty closes below 6000.
I have short positions in DLF, BHARTI and ICICIBANK and sitting on good profits.
Please look at the charts and carefully decide your entry and exit levels. It is not necessary that all the targets would be achieved in one or two days.
Note: If Nifty recovers, these stocks could retrace back to their break down levels, so if you are scared to short at these levels wait for any retracements and then go short when price is very near to break down levels so that have tight stop loss.
Casper,
Please share me the factors you usually use to decide the best stocks for Selling/Buying.
Vishy.
|
|
| Back to top |
|
 |
casper
Green Belt

Joined: 02 Oct 2010
Posts: 1315
|
Post: #260  Posted: Mon Nov 15, 2010 6:18 am Post subject: Posted: Mon Nov 15, 2010 6:18 am Post subject: |
 |
|
| vishytns wrote: | Casper,
I was going thru nifty heavyweights. I observed the following. Please check them aslo.
Vishy
Nifty Heavyweights
===================
1. Reliance - Double Top break down, Broadening Top formation
2. LT - Broadening top formation, break down level at 1980
3. Infosys tech - head and shoudlers, break down at 2970-2980 levels
4. ICICI Bank - Taking support at exactly 38.2% FIB retracement levels. break down would lead to next level
50% FIB retracement level - 1177,
5. HDFC Bank - Symmetrical Triangle, triangle support at 2270-2280 levels.
6. HDFC - Symmetrical Triangle |
due to heavy power cut could not post last night, so posting now, i have gone through all the scrips u mentioned buddy.only i would say that in case of infosys, the left shoulder is not prominent one, but still if it breaks the support line, downfall will occur.
|
|
| Back to top |
|
 |
casper
Green Belt

Joined: 02 Oct 2010
Posts: 1315
|
Post: #261  Posted: Mon Nov 15, 2010 6:55 am Post subject: Posted: Mon Nov 15, 2010 6:55 am Post subject: |
 |
|
| girishhu1 wrote: | vishytns/casperji,
you have posted charts of a no of stocks. can you now tell us which are 5 TOP stocks best for buy and sell for mondays trade , using any one indicator and any of the patterns you trust most. i think p/l ratio would be important for selecting the top stocks + reliability of the pattern. would you also take into consideration open interest, in case of f&o stocks? kindly elaborate
regards,
girish |
from sell side i would say dlf.unitech, bhartiartl and we may consider apollotyre -1m but in case of apollo the gap down factor may come in to the picture,
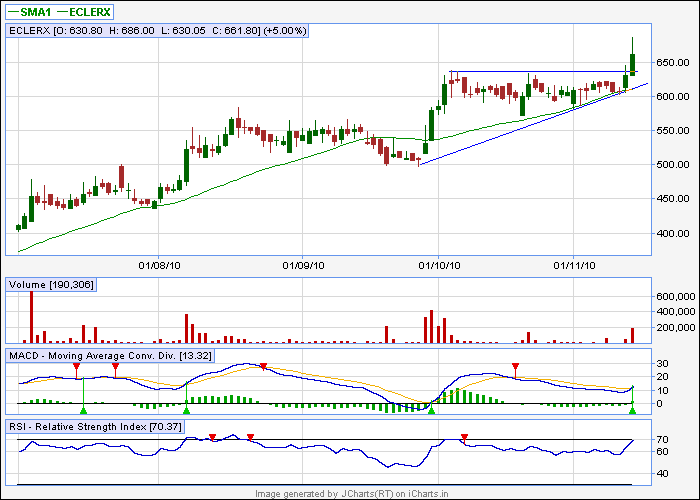
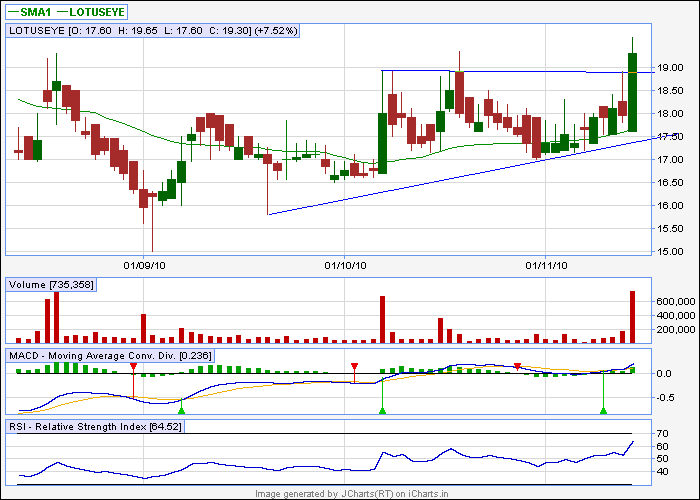
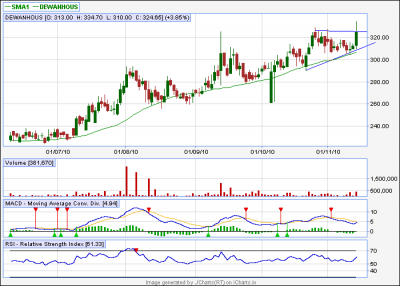
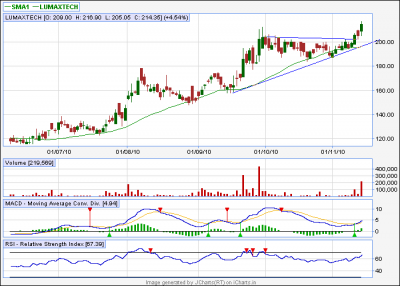
as from Saturday evening we have discussed about various types of break down, now i am going to put a few break out candidates, which i feel would zoom if they sustain their respective break out levels
lotuseye= target 21,23
eclerx = target 700,730,750.780
lumaxtech= target 220-235
dewanhous= if closes above 325 then 340-355 in coming days
vishy/girish bhai, i dont use many indicators during break outs, i only go for price action and volume, in case of normal positional holding, i use bollinger band, rsi and macd,
i think the idea of open interest is quite similar to the idea of volume, so i dont use it separately and as i trade mostly in bo/bd scrips nowadays, as these scrips are quite volatile due to break out and break down situation, so i dont follow any stock selection procedure strictly,
my favourite patterns are ascending triangles. descending triangles, symmetrical triangles and pennant, i try to find these patterns for trading instead of finding any particular stock
| Description: |
|
| Filesize: |
11.29 KB |
| Viewed: |
1718 Time(s) |
|
| Description: |
|
| Filesize: |
10.49 KB |
| Viewed: |
1718 Time(s) |
|
| Description: |
|
| Filesize: |
12.25 KB |
| Viewed: |
376 Time(s) |
|
| Description: |
|
| Filesize: |
12.11 KB |
| Viewed: |
371 Time(s) |
|
|
|
| Back to top |
|
 |
svrathi
White Belt

Joined: 05 Jul 2010
Posts: 14
|
Post: #262  Posted: Mon Nov 15, 2010 1:29 pm Post subject: Posted: Mon Nov 15, 2010 1:29 pm Post subject: |
 |
|
| casper wrote: | hi girish bhai,
yes u r right, and the fact that apollo tyre is going to go down heavily can be confirmed from the broadening top pattern also.
vishal, thanks and welcome! 
mr. sachin rathi,
sir plz let me know if u r considering an intraday or a positional short here? in case of intra day i prefer to decide it after viewing the real time chart(live intra day chart)
if u think to go for positional, u can use 350 by closing in case of dlf.
sbin 3180 by closing and bhartiartl 330 by closing,
special care should be taken in case of sbin, as target is small in comparison with stop loss and 89 ema is present around 3000, if u r not a risky trader, then u can avoid the sbin (in fact we were supposed to short it around 3400 and book around 3000-2950)
again, in case of heavy gap down opening the stocks may open around their respective targets also, in that case, we may see a choppy move or even a bounce back for intraday only, in that case, intra day shorts should be avoided |
Sir
Thank You Casper, for providing the SL. I m basically a Positional trader but also trade intraday. I have been trading trades only on Breckout & break down trades.
I m not able to calculate the SL's, what is the basic structure for SL. Please guide me if u can. Thank you very much once again.
Regards
Sachin Rathi
|
|
| Back to top |
|
 |
casper
Green Belt

Joined: 02 Oct 2010
Posts: 1315
|
Post: #263  Posted: Mon Nov 15, 2010 4:46 pm Post subject: Posted: Mon Nov 15, 2010 4:46 pm Post subject: |
 |
|
| svrathi wrote: | | casper wrote: | hi girish bhai,
yes u r right, and the fact that apollo tyre is going to go down heavily can be confirmed from the broadening top pattern also.
vishal, thanks and welcome! 
mr. sachin rathi,
sir plz let me know if u r considering an intraday or a positional short here? in case of intra day i prefer to decide it after viewing the real time chart(live intra day chart)
if u think to go for positional, u can use 350 by closing in case of dlf.
sbin 3180 by closing and bhartiartl 330 by closing,
special care should be taken in case of sbin, as target is small in comparison with stop loss and 89 ema is present around 3000, if u r not a risky trader, then u can avoid the sbin (in fact we were supposed to short it around 3400 and book around 3000-2950)
again, in case of heavy gap down opening the stocks may open around their respective targets also, in that case, we may see a choppy move or even a bounce back for intraday only, in that case, intra day shorts should be avoided |
Sir
Thank You Casper, for providing the SL. I m basically a Positional trader but also trade intraday. I have been trading trades only on Breckout & break down trades.
I m not able to calculate the SL's, what is the basic structure for SL. Please guide me if u can. Thank you very much once again.
Regards
Sachin Rathi |
calculating a stop loss is a tricky job,there is no hard and fast method.let us clear the basic situation a little bit elaborately,
why we need a stop loss??
i think the answer should be, after entering a trade, there are lot of chances, lot of unforeseen activities in the market, which can go against our trade, when we are using a stop loss, we are just limiting those unforeseen factors up to that level(stop loss level), and unless this level is breached, we will hope that the force which is going against our trade, will reverse in our favour.
that means, here we strongly believe two things:-
1. until the stop loss level is breached, there is possibilities, that the force may reverse in our favour
2.there will be less or absolutely no possibility for us if the level is breached by any means
now, let us incorporate these two points into a situation.
suppose, we are to short, then we will try to short at at resistance and will try to cover at a support,so here the resistance is the cause of the trade, and this resistance, until breached, will resist the price and price will go down and by any means, if this resistance is breached, then price will go upward and the resistance will act as a support to that up move, so in case of breaching this resistance, our trade becomes meaningless.
so this resistance level,with some cushion will act as our stop loss
in case of buy trade (long), we will buy at support and sell at resistance, and this support is the cause of buying ,hence it,with some cushion,should be our stop loss.
each time im using some cushion, because, due to intraday volatility, the support/resistance can be breached, but may not sustain, if u dont use a cushion with the original sup/resi level, then ur sl will be hit and then price will reverse
now our job will be to find out the points which has such characteristics, though it will vary case to case, but we can say some important ema, specially those who are fibonicci numbers such as 8/13/21/34/89 ema, upper and lower levels of bollinger band,in case of break out trading, the break out level(the upper trend line of the pattern) break down level (lower trend line of the pattern) can be considered as a potential sl.
in addition to that those who use pivot points, cam level,fib level, ichart levels can also use these levels as their stoploss
last but not least,  ( i know, u may be thinking that casper is writing a novel here but plz bear with me ( i know, u may be thinking that casper is writing a novel here but plz bear with me  ) )
in some cases, u may find that stop loss, calculated by any of the aforesaid methods, if get breached, will deliver a serious blow to ur economical health, so ur fingers might itch to bring it down to a comfortable level, BUT NEVER EVER DO THAT,IF U DO THIS, THEN THE SIGNIFICANT OF THE STOPLOSS WILL VANISH AND UR POSITION WILL BE VULNERABLE, IF U CANT AFFORD TO GET THAT STOP HIT, U JUST AVOID THAT TRADE AND FIND ANOTHER ONE, WHERE, U CAN DIGEST THE SL HIT,so instead of searching a trade by profit prospect, i feel its better to search a trade where risk component is low
thats all for now, if u want to know any thing else, plz feel free to ask
|
|
| Back to top |
|
 |
girishhu1
White Belt

Joined: 17 Aug 2009
Posts: 316
|
Post: #264  Posted: Mon Nov 15, 2010 5:01 pm Post subject: Posted: Mon Nov 15, 2010 5:01 pm Post subject: |
 |
|
congrats casperji,
all the bo stocks predicted by u, up > 3-4%. since intraday charts are not available for these stocks on icharts, how do you monitor your positions intraday?
girish 
|
|
| Back to top |
|
 |
svrathi
White Belt

Joined: 05 Jul 2010
Posts: 14
|
Post: #265  Posted: Mon Nov 15, 2010 5:40 pm Post subject: Posted: Mon Nov 15, 2010 5:40 pm Post subject: |
 |
|
| casper wrote: | | svrathi wrote: | | casper wrote: | hi girish bhai,
yes u r right, and the fact that apollo tyre is going to go down heavily can be confirmed from the broadening top pattern also.
vishal, thanks and welcome! 
mr. sachin rathi,
sir plz let me know if u r considering an intraday or a positional short here? in case of intra day i prefer to decide it after viewing the real time chart(live intra day chart)
if u think to go for positional, u can use 350 by closing in case of dlf.
sbin 3180 by closing and bhartiartl 330 by closing,
special care should be taken in case of sbin, as target is small in comparison with stop loss and 89 ema is present around 3000, if u r not a risky trader, then u can avoid the sbin (in fact we were supposed to short it around 3400 and book around 3000-2950)
again, in case of heavy gap down opening the stocks may open around their respective targets also, in that case, we may see a choppy move or even a bounce back for intraday only, in that case, intra day shorts should be avoided |
Sir
Thank You Casper, for providing the SL. I m basically a Positional trader but also trade intraday. I have been trading trades only on Breckout & break down trades.
I m not able to calculate the SL's, what is the basic structure for SL. Please guide me if u can. Thank you very much once again.
Regards
Sachin Rathi |
calculating a stop loss is a tricky job,there is no hard and fast method.let us clear the basic situation a little bit elaborately,
why we need a stop loss??
i think the answer should be, after entering a trade, there are lot of chances, lot of unforeseen activities in the market, which can go against our trade, when we are using a stop loss, we are just limiting those unforeseen factors up to that level(stop loss level), and unless this level is breached, we will hope that the force which is going against our trade, will reverse in our favour.
that means, here we strongly believe two things:-
1. until the stop loss level is breached, there is possibilities, that the force may reverse in our favour
2.there will be less or absolutely no possibility for us if the level is breached by any means
now, let us incorporate these two points into a situation.
suppose, we are to short, then we will try to short at at resistance and will try to cover at a support,so here the resistance is the cause of the trade, and this resistance, until breached, will resist the price and price will go down and by any means, if this resistance is breached, then price will go upward and the resistance will act as a support to that up move, so in case of breaching this resistance, our trade becomes meaningless.
so this resistance level,with some cushion will act as our stop loss
in case of buy trade (long), we will buy at support and sell at resistance, and this support is the cause of buying ,hence it,with some cushion,should be our stop loss.
each time im using some cushion, because, due to intraday volatility, the support/resistance can be breached, but may not sustain, if u dont use a cushion with the original sup/resi level, then ur sl will be hit and then price will reverse
now our job will be to find out the points which has such characteristics, though it will vary case to case, but we can say some important ema, specially those who are fibonicci numbers such as 8/13/21/34/89 ema, upper and lower levels of bollinger band,in case of break out trading, the break out level(the upper trend line of the pattern) break down level (lower trend line of the pattern) can be considered as a potential sl.
in addition to that those who use pivot points, cam level,fib level, ichart levels can also use these levels as their stoploss
last but not least,  ( i know, u may be thinking that casper is writing a novel here but plz bear with me ( i know, u may be thinking that casper is writing a novel here but plz bear with me  ) )
in some cases, u may find that stop loss, calculated by any of the aforesaid methods, if get breached, will deliver a serious blow to ur economical health, so ur fingers might itch to bring it down to a comfortable level, BUT NEVER EVER DO THAT,IF U DO THIS, THEN THE SIGNIFICANT OF THE STOPLOSS WILL VANISH AND UR POSITION WILL BE VULNERABLE, IF U CANT AFFORD TO GET THAT STOP HIT, U JUST AVOID THAT TRADE AND FIND ANOTHER ONE, WHERE, U CAN DIGEST THE SL HIT,so instead of searching a trade by profit prospect, i feel its better to search a trade where risk component is low
thats all for now, if u want to know any thing else, plz feel free to ask |
Dear Casper,
Thanks once again for your valuable comment & time.
That is very true when u dont have SL, then u may get vanished at any given point of time. And if anyone can digest the SL then he/she may enter the trade. So here risk reward ratio becomes very important.
Unless and until your risk reward ratio permits u, after going the study mentioned by you one should not enter the trade. Again Thanks very much.
Waiting for your more calls, as and when it comes.
Regards
Sachin Rathi
|
|
| Back to top |
|
 |
vishytns
White Belt

Joined: 26 Nov 2009
Posts: 206
|
Post: #266  Posted: Mon Nov 15, 2010 8:30 pm Post subject: Posted: Mon Nov 15, 2010 8:30 pm Post subject: |
 |
|
casper,
 
Very good explanation on stop loss. Your calls were rocking today.
Keep up the good job buddy.
Vishy.
|
|
| Back to top |
|
 |
casper
Green Belt

Joined: 02 Oct 2010
Posts: 1315
|
Post: #267  Posted: Mon Nov 15, 2010 8:31 pm Post subject: Posted: Mon Nov 15, 2010 8:31 pm Post subject: |
 |
|
hi girish bhai,
u can use yahoo charts to see the scrips not charted by ichart. i just trail my stop in these cases, because after getting rt chart from ichart, other website's chart looks like lifeless to me, so i dont try to see it in other websites
hi mr rathi, thanks and welcome
|
|
| Back to top |
|
 |
casper
Green Belt

Joined: 02 Oct 2010
Posts: 1315
|
Post: #268  Posted: Mon Nov 15, 2010 8:39 pm Post subject: Posted: Mon Nov 15, 2010 8:39 pm Post subject: |
 |
|
| vishytns wrote: | casper,
 
Very good explanation on stop loss. Your calls were rocking today.
Keep up the good job buddy.
Vishy. |
 thank vishy,but i must mention that u supplied most of the materials like dlf, unitech and others short calls, they have also achieved target except airtel. thank vishy,but i must mention that u supplied most of the materials like dlf, unitech and others short calls, they have also achieved target except airtel.
if u were not here, being a lazy boy, i wont research so much and its very true that our performance has increased manifold after ur joining,
WE ARE A TEAM!!!!!

|
|
| Back to top |
|
 |
vishytns
White Belt

Joined: 26 Nov 2009
Posts: 206
|
Post: #269  Posted: Mon Nov 15, 2010 9:38 pm Post subject: Posted: Mon Nov 15, 2010 9:38 pm Post subject: |
 |
|
Casper,
Appreciate your team spirit buddy. Yes! we are a team, let us work with passion to master techincal analysis.
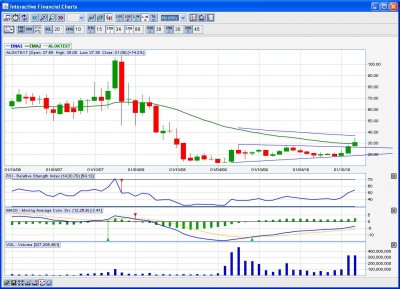
Check ALOKTEXT, this stock is going up on volumes, looks like it has broken out of symmetrical triangle in monthly charts. Please have a look and provide your views.
Vishy.
| Description: |
|
| Filesize: |
131.75 KB |
| Viewed: |
371 Time(s) |
|
|
|
| Back to top |
|
 |
vishytns
White Belt

Joined: 26 Nov 2009
Posts: 206
|
Post: #270  Posted: Mon Nov 15, 2010 9:46 pm Post subject: Posted: Mon Nov 15, 2010 9:46 pm Post subject: |
 |
|
Casper,
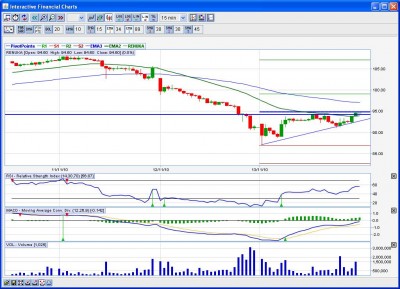
Check Renuka in 15 minutes chart, Ascending triangle formation break out. one more day with good volumes can be considered as a breakout. Please provide your views
Vishy
| Description: |
|
| Filesize: |
133.72 KB |
| Viewed: |
380 Time(s) |
|
|
|
| Back to top |
|
 |
|
|
You cannot post new topics in this forum
You cannot reply to topics in this forum
You cannot edit your posts in this forum
You cannot delete your posts in this forum
You cannot vote in polls in this forum
You can attach files in this forum
You can download files in this forum
|
Powered by phpBB © 2001, 2005 phpBB Group
|
|
|

