|
|
| View previous topic :: View next topic |
| Author |
a layman's approach to break out and break down |
vishytns
White Belt

Joined: 26 Nov 2009
Posts: 206
|
Post: #271  Posted: Mon Nov 15, 2010 9:56 pm Post subject: Posted: Mon Nov 15, 2010 9:56 pm Post subject: |
 |
|
Casper,
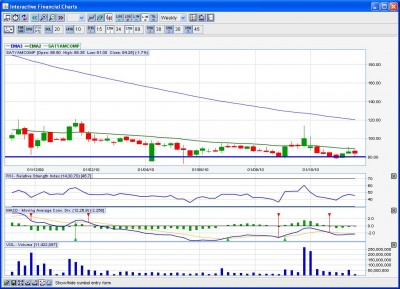
Look at SATYAM chart, looks like formation of head and shoulders. Neckline is at 80. I am not sure about this, so i require you to carefully examine the chart.
Moreover satyam has given out bad results.
Vishy
| Description: |
|
| Filesize: |
130.85 KB |
| Viewed: |
361 Time(s) |
|
|
|
| Back to top |
|
 |
|
|  |
vishytns
White Belt

Joined: 26 Nov 2009
Posts: 206
|
Post: #272  Posted: Mon Nov 15, 2010 9:59 pm Post subject: Posted: Mon Nov 15, 2010 9:59 pm Post subject: |
 |
|
Casper,
Look at SATYAM chart, looks like formation of head and shoulders. Neckline is at 80. I am not sure about this, so i require you to carefully examine the chart.
Moreover satyam has given out bad results.
Vishy
| Description: |
|
| Filesize: |
130.85 KB |
| Viewed: |
363 Time(s) |

|
|
|
| Back to top |
|
 |
vishytns
White Belt

Joined: 26 Nov 2009
Posts: 206
|
Post: #273  Posted: Mon Nov 15, 2010 10:06 pm Post subject: Posted: Mon Nov 15, 2010 10:06 pm Post subject: |
 |
|
Casper,
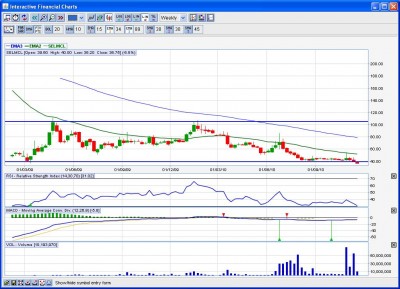
SELMCL, stock has broken down below the rectangular pattern. Please provide your view.
Vishy
| Description: |
|
| Filesize: |
133.07 KB |
| Viewed: |
370 Time(s) |
|
|
|
| Back to top |
|
 |
ravionlinek
White Belt

Joined: 11 Jun 2010
Posts: 97
|
|
| Back to top |
|
 |
casper
Green Belt

Joined: 02 Oct 2010
Posts: 1315
|
Post: #275  Posted: Tue Nov 16, 2010 7:52 am Post subject: Posted: Tue Nov 16, 2010 7:52 am Post subject: |
 |
|
hi vishy and ravionlinek
here is the result:
aloketext= nice finding vishy, but look at the picture u posted, its not symmetrical triangle, its an ascending triangle, target will be 40-50 in 1-2 months
renuka= yes, target will be 100-105
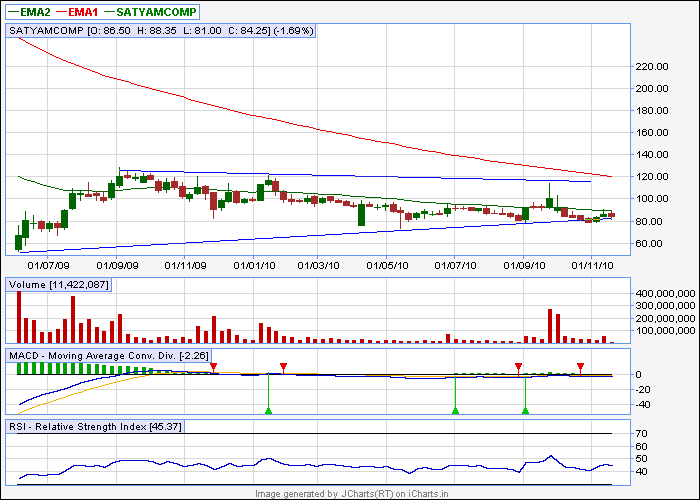
satyam= here the left shoulder is highest, so it cant be a h/s where middle shoulder is supposed to be the highest, again, if it sustain above 80 and gives a bo at 120 then it will form an ascending triangle. then target will be 150-160. but this will take at least 1-2 month to form the pattern
selmcl= yes its a rectangular bd. but i dont know how to comment on the target here, we get a target by subtracting low from the high, so it will be 110-40=70 rupees break down, but this one is trading at 40, so our target will be -30 
unitech= if sustain 70, u can buy, but i think it may test 60 also,let us see,
idea= yesterday it opened at support and closed at resistance, (bb lower and bb upper respectively) it can reach 73 if it trades above 70, now at 69.55, wait until it sustain 70, or else, it may go sideways
| Description: |
|
| Filesize: |
11.55 KB |
| Viewed: |
1831 Time(s) |
|
|
|
| Back to top |
|
 |
casper
Green Belt

Joined: 02 Oct 2010
Posts: 1315
|
Post: #276  Posted: Tue Nov 16, 2010 8:15 pm Post subject: Posted: Tue Nov 16, 2010 8:15 pm Post subject: |
 |
|
| casper wrote: | hi vishy, welcome back
yes u r right, its a broadening top and a break down below 6000 will confirm the pattern,
in case of broadening top, we need to measure the distance of break down level from the top and project it downward, in this case, target will be some where around 5700,(my goodness)
what an extra ordinary perception u have vishy,,,,  , frankly speaking if u did not name it in ur post, i would not have dreamt of it, as it is so rare and so devastating, now after a close below 6000, we will have 5700 as a target, its still ok with me if nifty get corrected this way, but if foreign money save it this time again, then the next fall (whenever it occur) will be a tragedy , frankly speaking if u did not name it in ur post, i would not have dreamt of it, as it is so rare and so devastating, now after a close below 6000, we will have 5700 as a target, its still ok with me if nifty get corrected this way, but if foreign money save it this time again, then the next fall (whenever it occur) will be a tragedy |
6000 gone.......whats next? 
|
|
| Back to top |
|
 |
vishytns
White Belt

Joined: 26 Nov 2009
Posts: 206
|
Post: #277  Posted: Tue Nov 16, 2010 8:26 pm Post subject: Posted: Tue Nov 16, 2010 8:26 pm Post subject: |
 |
|
Casper,
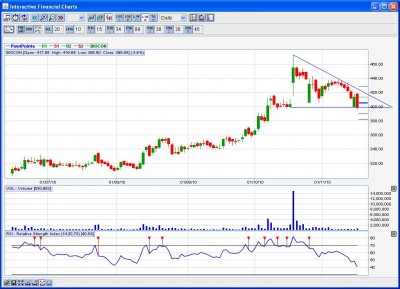
Check BIOCON, Descending Triangle break out. Volumes are low, we need to check the volumes in comming days. If Volumes are not HIGH then this could be false one.
Please provide me your views.
Vishy
| Description: |
|
| Filesize: |
122.71 KB |
| Viewed: |
367 Time(s) |
|
|
|
| Back to top |
|
 |
vishytns
White Belt

Joined: 26 Nov 2009
Posts: 206
|
Post: #278  Posted: Tue Nov 16, 2010 8:34 pm Post subject: Posted: Tue Nov 16, 2010 8:34 pm Post subject: |
 |
|
Casper,
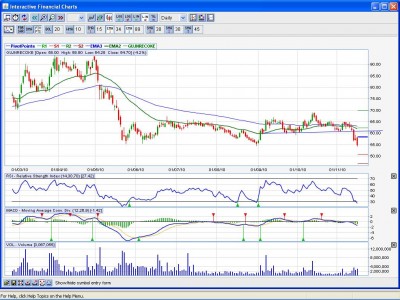
Check GUJNRECOKE, head and shoulders break down, 55 looks like good support, if it breaks then stock could have more down side.
Vishy.
| Description: |
|
| Filesize: |
154.69 KB |
| Viewed: |
367 Time(s) |
|
|
|
| Back to top |
|
 |
vishytns
White Belt

Joined: 26 Nov 2009
Posts: 206
|
Post: #279  Posted: Tue Nov 16, 2010 8:39 pm Post subject: Posted: Tue Nov 16, 2010 8:39 pm Post subject: |
 |
|
Casper,
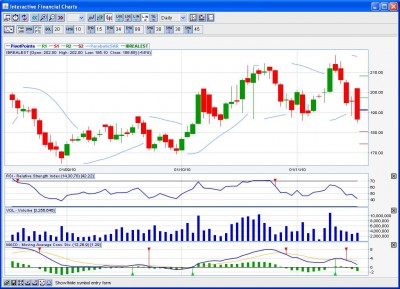
IBREALEST, looks like has formed and double top and broken down. Check the chart and let me know your views.
Vishy
| Description: |
|
| Filesize: |
135.64 KB |
| Viewed: |
359 Time(s) |
|
|
|
| Back to top |
|
 |
mrvishal_g
White Belt

Joined: 17 Sep 2010
Posts: 89
|
Post: #280  Posted: Tue Nov 16, 2010 9:12 pm Post subject: Posted: Tue Nov 16, 2010 9:12 pm Post subject: |
 |
|
Hello Casper,
I am in very bad condition  bcos i already told you that i m holding HCC lot @63.5. It was near 66 on friday( i was waiting for 70-72). I was out of station since sunday evening and just see rate of HCC 57.15 bcos i already told you that i m holding HCC lot @63.5. It was near 66 on friday( i was waiting for 70-72). I was out of station since sunday evening and just see rate of HCC 57.15
Now suggest what to do bcoz it looks very weak on chart.
One more thing i have a ebook which have almost all the pattern detail.(how to identify, chance of failure, trading tips, etc.)I think it is very good ebook seriously (but i haven't read it  ). I think it can sharp you people who are hardworking and giving time. ). I think it can sharp you people who are hardworking and giving time.
Its a pdf file size is more than 9MB even 7.5MB after zip. I tried to upload it for you people but failed ( may be bcoz of its size)
Tell me how can i upload it.???(if you are interest to see it)
Vishal
|
|
| Back to top |
|
 |
casper
Green Belt

Joined: 02 Oct 2010
Posts: 1315
|
Post: #281  Posted: Tue Nov 16, 2010 10:03 pm Post subject: Posted: Tue Nov 16, 2010 10:03 pm Post subject: |
 |
|
hi vishy,
biocon is a perfect descending triangle, during pattern formation, generally we see a decrease in vol, so its normal, vol will only get back during bo/bd, so we have to see the vol during bo/bd
in case of guj nre coke, a break down below 55 will reach around 45 level
ibrealest= a break down from 185 will lead to a down fall for 20 rupees atleast
vishal,
what u have done??? i replied u that 67 will be a resistance and then only expect 70  u could have sell it when u saw it could not cross 67. u could have sell it when u saw it could not cross 67.
important support level is broken, now we can target 54-52 in coming days, but dont panic brother, "himmat e marda toh madad e khuda"u can try any of the following methods
1, buy put to hedge the position
2. sell 2-3 lot of hcc and cover at lower levels
this is a dangerous time, plz dont leave any unattained open position for now
once i posted a candle stick e book, u can find it here http://www.icharts.in/forum/a-laymans-approach-to-break-out-and-break-down-t2878,postorder,desc,start,250.html
and i never uploaded such a big file in ichart, may be uploading this kind of big file is prohibited, can u make a word document in 2-3 parts by just copying and pasting in some word file? so that 2-3 separate book with less volume will be generated?
|
|
| Back to top |
|
 |
vishytns
White Belt

Joined: 26 Nov 2009
Posts: 206
|
Post: #282  Posted: Wed Nov 17, 2010 10:38 am Post subject: Posted: Wed Nov 17, 2010 10:38 am Post subject: |
 |
|
Casper,
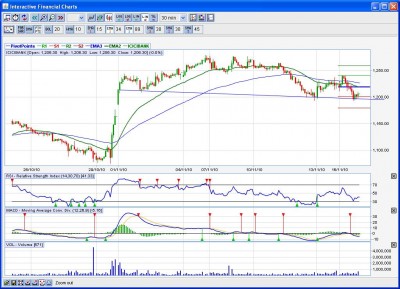
ICICIBank head and shoulders formation (60min tf)? Please check it and provide your views.
Vishy
| Description: |
|
| Filesize: |
138.84 KB |
| Viewed: |
354 Time(s) |
|
|
|
| Back to top |
|
 |
casper
Green Belt

Joined: 02 Oct 2010
Posts: 1315
|
Post: #283  Posted: Wed Nov 17, 2010 6:10 pm Post subject: Posted: Wed Nov 17, 2010 6:10 pm Post subject: |
 |
|
hi vishy,
sorry i am very late!!! in fact i have downloaded so many charts in last couple of weeks or so, that my download folder is almost flooding with charts, among them, there are charts of back testing, live market testing such as,chart at the time of taking a paper trade and chart after the bo/bd.so from the morning i was busy to sort them out and sent them in respective folders. our strategy testing session is rocking, so today i thought i should start sorting and shifting charts now and as all the examples can not be posted in the forum directly (as it will take huge page) so i thought to post some charts directly in the forum and make a sort of ebook with remaining charts and post that e book so that those who want to see in details can access them and other can avoid easily and to meet the deadline of Friday evening, i thought i must act now or else i am sure to miss the time line 
the icicibank chart u posted needs very careful look to confirm as a h/s pattern, but this is a h/s and the way u picked it up just shows how passionate u r towards ur work!! plz keep it up 
but one thing to mention, this scrip has taken support at the neckline and has consolidated, in order to get at 250-275 point down fall,we need to breach the neckline ,preferably with increased volume
|
|
| Back to top |
|
 |
raju87
White Belt

Joined: 27 Dec 2009
Posts: 4
|
Post: #284  Posted: Wed Nov 17, 2010 7:54 pm Post subject: TTK prestige Posted: Wed Nov 17, 2010 7:54 pm Post subject: TTK prestige |
 |
|
Hi Casper,
Ttkprestige as per charts looks like formation of head and shoulder. Please comment. 
|
|
| Back to top |
|
 |
mrvishal_g
White Belt

Joined: 17 Sep 2010
Posts: 89
|
Post: #285  Posted: Wed Nov 17, 2010 8:55 pm Post subject: Posted: Wed Nov 17, 2010 8:55 pm Post subject: |
 |
|
Thanks Casper,
I find some stock, give your view
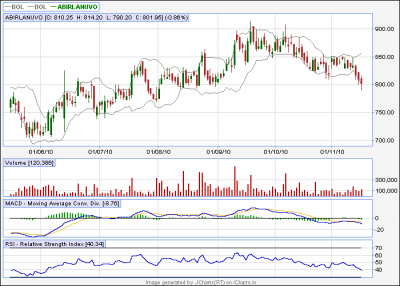
Abirla 804........sell bb support break also convert in downtrend from uptrend.
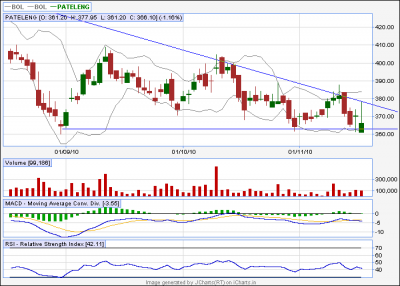
Patel eng 366.8....Sell decending tringle
Bank of baroda 972....sell near bb support once break 960 then it may be a good short bcoz it is in uptrend from Feb.'10
one more request, tell me in brief how you calculate time to achieve target after bd/bo.
I tried to copy paste in work from pdf ebook but formatting as well as chart are not coming in word, i will try once again.
Vishal
| Description: |
|
| Filesize: |
13.84 KB |
| Viewed: |
360 Time(s) |
|
| Description: |
|
| Filesize: |
12.08 KB |
| Viewed: |
328 Time(s) |
|
|
|
| Back to top |
|
 |
|
|
You cannot post new topics in this forum
You cannot reply to topics in this forum
You cannot edit your posts in this forum
You cannot delete your posts in this forum
You cannot vote in polls in this forum
You can attach files in this forum
You can download files in this forum
|
Powered by phpBB © 2001, 2005 phpBB Group
|
|
|

