|
|
| View previous topic :: View next topic |
| Author |
a layman's approach to break out and break down |
ronypan
White Belt

Joined: 07 Aug 2010
Posts: 197
|
Post: #2761  Posted: Thu Jul 07, 2011 12:19 pm Post subject: HDIL Posted: Thu Jul 07, 2011 12:19 pm Post subject: HDIL |
 |
|
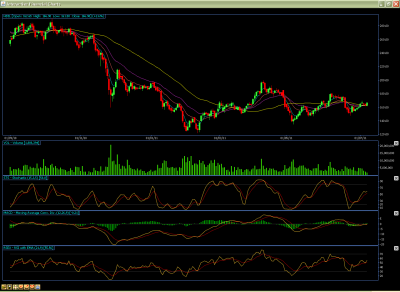
HDIL POSITIVE 166.. IT CAN TEST 174-176
| Description: |
|
| Filesize: |
103.96 KB |
| Viewed: |
405 Time(s) |
|
|
|
| Back to top |
|
 |
|
|  |
sumesh_sol
Brown Belt

Joined: 06 Jun 2010
Posts: 2344
|
Post: #2762  Posted: Fri Jul 15, 2011 11:55 am Post subject: SESAGOA Posted: Fri Jul 15, 2011 11:55 am Post subject: SESAGOA |
 |
|
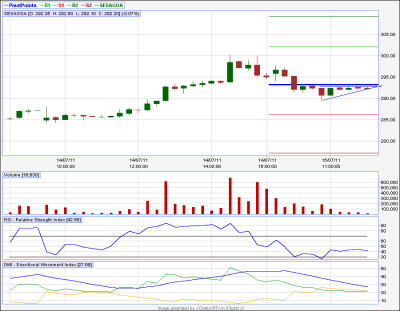
SESAGOA..15tf
***************
Close in 15tf above 292.7 can take it to 297/300
SL 289.4
| Description: |
|
| Filesize: |
14.33 KB |
| Viewed: |
386 Time(s) |
|
|
|
| Back to top |
|
 |
sumesh_sol
Brown Belt

Joined: 06 Jun 2010
Posts: 2344
|
Post: #2763  Posted: Fri Jul 15, 2011 1:04 pm Post subject: BHEL Posted: Fri Jul 15, 2011 1:04 pm Post subject: BHEL |
 |
|
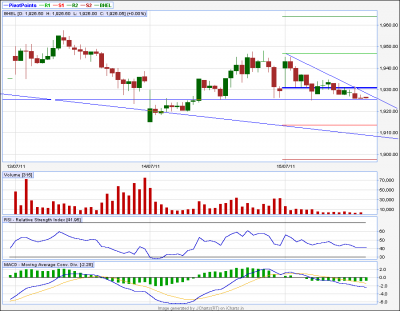
BHEL..15tf
***********
Below 1924, it can reach 1910/ 1900
| Description: |
|
| Filesize: |
14.18 KB |
| Viewed: |
419 Time(s) |
|
|
|
| Back to top |
|
 |
casper
Green Belt

Joined: 02 Oct 2010
Posts: 1315
|
Post: #2764  Posted: Fri Aug 12, 2011 7:21 pm Post subject: Posted: Fri Aug 12, 2011 7:21 pm Post subject: |
 |
|
hi anantha ji
the following is a response to ur query
trend lines
**********
before we go in to deep, let us see why we will need them and what we can expect from them, its a basic conceptions, but some times we need to get back to the basics
market goes by supply and demands, and a trader is essentially trying to guess the power of supply and demand and then he is supposed to place his "bet" on the supposedly winning side
if somehow the trader thinks that soon demand will surge he will buy, in a hope to sell the asset at a higher price and if he thinks that soon supply is going to get the market flooded, he will try to open a short position, expecting covering the asset in a lower price, this is the fact of market which we all know and apparently it is very simple thing, just we need to know when demand will be over powered by supply , so that we can short, or what will be the point when supply will be over powered by demand, so that we can open some longs, and by any miracle, if we could find them properly in every occasion, then we will become legendary trader...... its so easy
  
all the armory of indicators, concepts, waves , are essentially trying to point out this supply/demand imbalance zone and nothing else
assuming this much is clear, let us think for a while, what is a top and what is a bottom???
top
*****
top is the highest point of a chart, which shows maximum power of demand, and which MUST BE over powered by supply, why must be??? becoz, after reaching a top. price will never go any further and will start declining, making that point, the HIGHEST point of the chart, so top is , we can say, is the place where bull fought with its 100% power but got defeated by bear....
so it must be a "supply" point, am i clear up to this???
now let us see what happens in bottom.....
bottom
*******
this is the lowest point of a chart, which shows maximum power of supply and it MUST be over powered by demand, as below this point, price never ventures, so it must be the point where bear showed his greatest ability but got defeated by bulls
so it must be a "demand" point..... right???
so what happens in a chart???
when price, after a fall, reaches these bottoms, which are actually demand points or buying points, demand comes in to play and price zooms as if "some thing came from nowhere and SUPPORTED the price" so the fall got
arrested and price zoomed
so we can call these bottoms or demand points as "SUPPORT"
same goes for tops also, these are the points where selling comes from"god knows where"and make the price tumble...... as if some sort of obstacle is there, which is "RESISTING" any further up move
so we can refer these tops or supply points as "resistance" too
now if we connect the demand points with a line, it will show us a picture of the past, how and when demand came to the asset, we will call this line a support line, which will show us the "TREND" of support came to the asset
same, if we connect the supply points it will show us the previous picture of how and when supply came to the concerned case, since it will resist any upmove, so it will show us the "trend" of resistance
now, in a 2d plain, we can connect any two points and call it a straight line or a ray and geometrically we will be right also, but in t.a we deal with mass psychology which is not so easy
so to draw a trend line correctly, we will need another point, supply or demand [as per the nature of the trend line] to come , touch and thus validate our straight line to be called a TRUE TREND LINE, bcoz, if we draw a trend line properly , then only it will act as a future support or resistance, and if it acts as a support or resistance, then our job is done....
bcoz, just remember, when we started this, we just wanted to see when support [demand] will come and when resistance [supply] will come, and nothing else....
so in short, we will draw a line from a supply/demand point up to another supply/demand point expecting it will be "retested" by a 3rd supply/demand point, and if it does, then our trend line is valid one,bcoz only valid trend line can offer support/resistance, no body else can do that
now final stage, how it is going to affect ur pattern???
when u r drawing a pattern in a chart, u r essentially trying to show a congestion which is covered by a strong support and a strong resistance, or in other words, it will be a place in the chart, which will be confined by supply and demand and when u expect a break out or break down in that pattern, u r essentially expecting a point EITHER SUPPLY WILL OVERWHELM THE DEMAND [BREAK DOWN] OR DEMAND WILL OVER POWER THE SUPPLY [BREAK OUT]
now, if we can not draw tls which touches at least 3 points of supply/demands, how we will be able to show the force which made price confined within that space???
  
and if cant get an idea of where is supply and where is demand, how we will bet??
got my point??
thats the reason i told u in morning that we need tls touching 3 points for a better pattern and further move
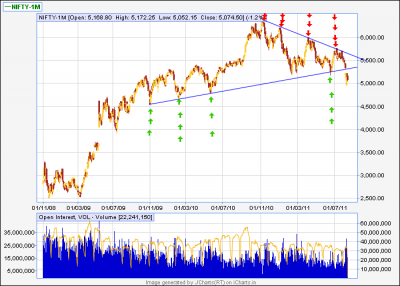
finally i am attaching a nifty long time chart, where i have marked the demand by green arrows and supplies as red arrows, check it and if any question comes to ur mind, plz dont hesitate to ask me
  
| Description: |
|
| Filesize: |
28.51 KB |
| Viewed: |
403 Time(s) |
|
|
|
| Back to top |
|
 |
vinay28
Black Belt

Joined: 24 Dec 2010
Posts: 11748
|
Post: #2765  Posted: Fri Aug 12, 2011 8:15 pm Post subject: Posted: Fri Aug 12, 2011 8:15 pm Post subject: |
 |
|
Thanks Casper. Explained in a very simple and beautiful way so that even I can understand. Could you please bother to answer a few queries of mine given below?
1. Surely this applies to intraday chart also? I am asking this because I keep on doing it every 15 min or so with a foot scale on my PC. I use foot scale because drawing a trend line with curser (by dragging mouse) is never perfect.
2. In the chart attached by you, recent nifty values broke support line, right?. But what if massive demand comes at this stage. Wouldn't we have to create a new trendline, which unfortunately can not find at least 3 demad points as of now? At least I couldn't.
I am saying this because I also try to find correlation amongst other info. e.g. NF closed at 5074.50 at 3.30 pm while sgx nifty suddenly (?) rose to 5150 at 3.40 pm. May be it is a false move like today morning but just your thoughts please. You have stated that a trader has to "guess" when demand will arise and may be such extranneous signals will guide?
Thanks as always
Vinay
|
|
| Back to top |
|
 |
casper
Green Belt

Joined: 02 Oct 2010
Posts: 1315
|
Post: #2766  Posted: Fri Aug 12, 2011 9:38 pm Post subject: Posted: Fri Aug 12, 2011 9:38 pm Post subject: |
 |
|
hi vinay
here i am replying ur queries one by one
1. yes concept of trend line and its a more developed cousin ... the trend channel is applicable for any tf , wherever u find a trend u can use them, personally i know a trader from blore [ u too from blore i guess] who is like my elder brother [vishy anna]and one of the finest t.a i hv ever seen, though its not his profession. he trades with 1min tf chart with trend lines and whenever he trades, he gains handsomely , so u can guess from his example, that u can use it in any tf u r comfortable with
2.our icharts charting system [ and most other charting s/ws also] uses a technology which will never let ur trend line get deviated or wrongly placed provided u start from a point and finish another point correctly, it will always make a perfect straight line
so whenever u try to draw a tl, first identify the two points u want to connect visually and then go ahead, just keep it in mind that these two point should be "extremes", we dont need them to be 52 weeks high lows, just an extreme which should pop out in the fled u r working will do the job
3. yes nifty got broken down, we are below the support tl [lower one] so its a break down case, and i repeatedly posted that we will go down in forum for last 3-4 months, but this huge gap is making me uneasy, in theory, every demand will have to breach this gap and then break the lower tl of nifty to bring the word "buying" back into our dictionary [ i mean positionally, intra buy /sell will go as usual] so whatever demand comes, it has some strongest level upwards to breach, its not easy any more, sgx nifty or sudden surge in dow will give us some gap up opening at the best, we need some buying, serious buying to happen to break all these levels and make a trend reversal, here u should note that its no longer short term case any more..... mid term is also negative and probably we are in long term down trend too [ there is no universal definition of short/mid/long term , at least i dont know, so used "probably" word]
now merely a surge in sgx wont give us much respite, and u will notice, as traders trade on broker's money, viz leverage, so they tend to close their existing positions by weekend,[to avoid a margin call] so its a natural phenomenon that normally we have an opposite mood on thursday/friday than the mood which was prevalent from monday
so over all, i dont think we will soon have any good reason to buy and its also true now two good supports are seen, 4800 range and 4000 range, so technically we can find support there, or even we can have choppy days ahead too, we have traveled a lot of distance very fast, so choppiness ofcourse can come here
4.finally if we assume a new trend is starting, reversing the present one, it will start afresh, and thus this trend will make its own trend lines for sure and we will find that tl in intra day charts first, and there we will surely find 3 points tl
then as the trend matures, it will be visible in daily, weekly and even higher charts , constituting its own trend lines for those tfs step by steps
|
|
| Back to top |
|
 |
vinay28
Black Belt

Joined: 24 Dec 2010
Posts: 11748
|
Post: #2767  Posted: Sat Aug 13, 2011 12:12 pm Post subject: Posted: Sat Aug 13, 2011 12:12 pm Post subject: |
 |
|
| Great Casper, thanks
|
|
| Back to top |
|
 |
rk_a2003
Black Belt

Joined: 21 Jan 2010
Posts: 2734
|
Post: #2768  Posted: Sat Aug 13, 2011 12:52 pm Post subject: Posted: Sat Aug 13, 2011 12:52 pm Post subject: |
 |
|
Casper !
I am able to make 8 to 15 points in nifty. Just by drawing trend lines/channels and going long or short when ever I feel apt for entry.
Only occasionally I book losses of 10 points .I can say 75 % trades are successful.
I have started this method recently, as I am not a full time trader. My each trade exists only 2 - 8 minutes till this time, and it really suits for me as this method is not demanding prolonged times in front of screen.
I got inspiration to do this from reading your thread.
Thank You! I solicit your comments / warnings if any.
|
|
| Back to top |
|
 |
casper
Green Belt

Joined: 02 Oct 2010
Posts: 1315
|
Post: #2769  Posted: Sat Aug 13, 2011 1:46 pm Post subject: Posted: Sat Aug 13, 2011 1:46 pm Post subject: |
 |
|
hi vinay and rk
thanks and welcome
rk
brother i have the following suggestions if u wish to trade with trend lines extensively
1.price hitting a trend line is not necessarily going to reverse the trend or break it and continue, so if u want a reverse trade with sl fo the trend line, then u should look for proper entry signals
2.i see the following signals for an entry near a trend line or other kind of support or resistance
i. either look for a candle pattern, such as morning/evening star or hammer/inv hammer wid good volume[ volume rule is for hammer/inv hammer only] u will see some hammers have very less volume when u compare wid rest of the candles, it will NEVER reverse the price, no matter how good the support/resi is there
u should look for a hammer/inv hammer with extra ordinary volume, [ here vol will be as such, that u will wonder, how a hammer, which is a modification of dozi, can gather so much volume], this will give u almost sure shot signal for a reversal and an excellent opportunity to entry/exit
ii.watch for divergence in rsi just next to the level or trend line, if u know what is divergence actually [according to their post made in forum,lots of seniors even dont know, its very tricky thing actually] then use it and it will mint heavily that i can guarantee
finally, once u get enough experiences and develop ur own set of money management rules, u can use the same method in positional trades as well
here i am giving u a link, its a thread done by another ichartian, "as4manju" if u r new here , then u may not know him, but he is they guy who can make amazing trades only on trend line analysis
[ he is my present business partner  , so i know him very well and i can assure u that he never ever used any thing other than trend line in his entire trading career, therefore, if u take a look at the chart he posted and their subsequent results, i am sure ur conception of using trend line will be much more clear] , so i know him very well and i can assure u that he never ever used any thing other than trend line in his entire trading career, therefore, if u take a look at the chart he posted and their subsequent results, i am sure ur conception of using trend line will be much more clear]
http://www.icharts.in/forum/stock-call-t2927,postorder,desc,start,690.html
|
|
| Back to top |
|
 |
rk_a2003
Black Belt

Joined: 21 Jan 2010
Posts: 2734
|
Post: #2770  Posted: Sat Aug 13, 2011 2:33 pm Post subject: Posted: Sat Aug 13, 2011 2:33 pm Post subject: |
 |
|
Thank You so much Casper!
I shall work on these guidelines.
|
|
| Back to top |
|
 |
ronypan
White Belt

Joined: 07 Aug 2010
Posts: 197
|
Post: #2771  Posted: Sat Aug 13, 2011 6:56 pm Post subject: AMBUJACEM Posted: Sat Aug 13, 2011 6:56 pm Post subject: AMBUJACEM |
 |
|
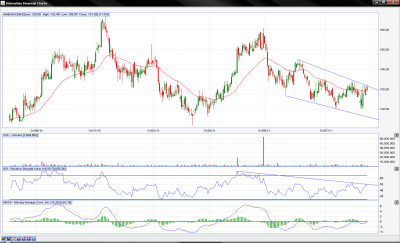
AMBUJACEM.. Can We See 8 to 10% Upmove?
| Description: |
|
| Filesize: |
104.15 KB |
| Viewed: |
438 Time(s) |
|
|
|
| Back to top |
|
 |
vinay28
Black Belt

Joined: 24 Dec 2010
Posts: 11748
|
Post: #2772  Posted: Sat Aug 13, 2011 8:05 pm Post subject: Posted: Sat Aug 13, 2011 8:05 pm Post subject: |
 |
|
Hi Casper
If I understood you correctly, trendlines can only be a line that connects lowest and highest points (and at least three of them). However, when I went through as4manju's threads, I found that his trendlines "transcend" across some lower lows or higher highs i.e. he has ignored them.
First of all, am I right in this observation. If so. what do you think of the (trend) line which joins the lows of nifty in end Nov '10, end May '11 and yesterday's (or is it the day before's?) low? Does that become a support line?
Vinay
|
|
| Back to top |
|
 |
casper
Green Belt

Joined: 02 Oct 2010
Posts: 1315
|
Post: #2773  Posted: Sat Aug 13, 2011 10:23 pm Post subject: Re: AMBUJACEM Posted: Sat Aug 13, 2011 10:23 pm Post subject: Re: AMBUJACEM |
 |
|
| ronypan wrote: | | AMBUJACEM.. Can We See 8 to 10% Upmove? |
only if it stays above 132 with good volume then we can expect some up moves here
but adx is very very low, so a choppy move, followed by a violent trend is likely
|
|
| Back to top |
|
 |
casper
Green Belt

Joined: 02 Oct 2010
Posts: 1315
|
Post: #2774  Posted: Sat Aug 13, 2011 10:40 pm Post subject: Posted: Sat Aug 13, 2011 10:40 pm Post subject: |
 |
|
| vinay28 wrote: | Hi Casper
If I understood you correctly, trendlines can only be a line that connects lowest and highest points (and at least three of them). However, when I went through as4manju's threads, I found that his trendlines "transcend" across some lower lows or higher highs i.e. he has ignored them.
First of all, am I right in this observation. If so. what do you think of the (trend) line which joins the lows of nifty in end Nov '10, end May '11 and yesterday's (or is it the day before's?) low? Does that become a support line?
Vinay |
yes u r right
when u start working with trend lines, u will find and some time say there is 10 tops, and if we try to connect them, then only 6 of them are actually coming in a line, in this case, we will have to scarifies the rest 4 as if we take 6out of 10 then we are covering majority of them and generally it will do the job
by seeing vishy anna and manju very closely, i am convinced that trend line analysis is the best way to trade, however as u have nothing more than a couple of lines on the chart, so mastering this art is a bit difficult for fresher, but once done, he can virtually loot the market
so i will tell u, draw all possible trend lines covering at least 3 points, say if u hv 7 tops and they could be covered by two tls, then ok, go ahead and draw both of them, if u do it for a month or so, u will see how chart will start talking with u and u will be able to predict not only trends but also "spikes" too
in weekdays i will become very busy, so will not be able to communicate with all of u as i do generally, so i am telling u to do one thing, draw whatever charts u wish and then if u r not sure,put them here , i will check and update u whenever i get a free time, but u must carry on practice as much as possible to learn t.a, bcoz its all about practice only
vinay u have found a very nice point in nifty, let me see, updating widin 5 min, very interesting one i guess
|
|
| Back to top |
|
 |
casper
Green Belt

Joined: 02 Oct 2010
Posts: 1315
|
Post: #2775  Posted: Sat Aug 13, 2011 10:58 pm Post subject: Posted: Sat Aug 13, 2011 10:58 pm Post subject: |
 |
|
vinay
what u did man???
  
apparently u changed the "horoscope" of nifty
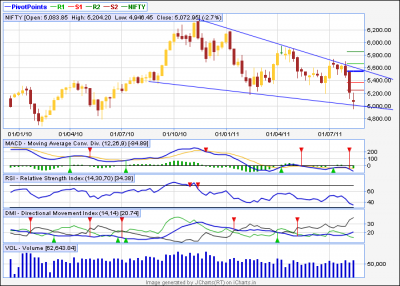
i have just changed the lower trend line a bit and see this picture,
we are at supportttttttttttt

and we closed this week as "dozi" it may mean a lot
dozi on a trend line is a not a good sign for a trend, trend is definitely weak here, if we dont close below this tl, we may have a pull back, upto 5500
now for a fall, either we will need to stay below this tl for a week or by the end of august we should be below 5080 by monthly closing, otherwise, we will have a chance of pull back for sure
thank u vinay, thank u very much, if u did not said it, i would have never know about this
we have strong resi upward, markets are crying every day. but we have a support and 34 ema in monthly chart still intact, so a possibility of pull back, in form a relief rally can not be ruled out
attached chart is nifty weekly
| Description: |
|
| Filesize: |
28.77 KB |
| Viewed: |
431 Time(s) |
|
|
|
| Back to top |
|
 |
|
|
You cannot post new topics in this forum
You cannot reply to topics in this forum
You cannot edit your posts in this forum
You cannot delete your posts in this forum
You cannot vote in polls in this forum
You can attach files in this forum
You can download files in this forum
|
Powered by phpBB © 2001, 2005 phpBB Group
|
|
|

