|
|
| View previous topic :: View next topic |
| Author |
a layman's approach to break out and break down |
rk_a2003
Black Belt

Joined: 21 Jan 2010
Posts: 2734
|
Post: #2776  Posted: Sat Aug 13, 2011 11:42 pm Post subject: Posted: Sat Aug 13, 2011 11:42 pm Post subject: |
 |
|
Yes!as per chart it appears Nifty may head for a relief rally next week.Doji formation supports that and friday US markets too seconding it.
Let us see what Global markets do on Monday.
Good shot Casper & Vinay 
|
|
| Back to top |
|
 |
|
|  |
vinay28
Black Belt

Joined: 24 Dec 2010
Posts: 11748
|
Post: #2777  Posted: Sun Aug 14, 2011 8:19 pm Post subject: Posted: Sun Aug 14, 2011 8:19 pm Post subject: |
 |
|
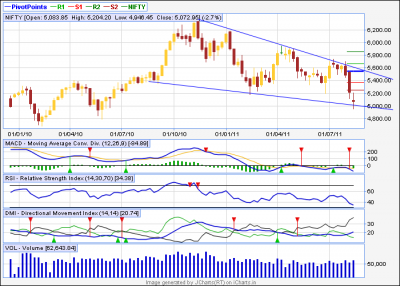
Many thanks Casper. I was observing the nifty chart for one year period and found this trendline. I will be all the more happy if market goes up, not only because I have investments but also because of some satisfaction that I am on the right track.
Clearly I did not understand your chart much but what I really want to know is why you did not draw a line that joins lows of end Nov, end May and last friday (or thursday)? Or is it that you did and thought it needed a change?
|
|
| Back to top |
|
 |
vinay28
Black Belt

Joined: 24 Dec 2010
Posts: 11748
|
Post: #2778  Posted: Sun Aug 14, 2011 8:55 pm Post subject: Posted: Sun Aug 14, 2011 8:55 pm Post subject: |
 |
|
| I am sorry casper. I mean end june and not may.
|
|
| Back to top |
|
 |
casper
Green Belt

Joined: 02 Oct 2010
Posts: 1315
|
Post: #2779  Posted: Sun Aug 14, 2011 9:16 pm Post subject: Posted: Sun Aug 14, 2011 9:16 pm Post subject: |
 |
|
ok
seen it , but that tl will not be very stronger one
but still , now we have two tls, and one shock in form of sbin result
if some how we manage to stay afloat on tues day over sbin news [its a heavyweight] then may be we will make a pull back from here. let see what happens on tues day
|
|
| Back to top |
|
 |
casper
Green Belt

Joined: 02 Oct 2010
Posts: 1315
|
|
| Back to top |
|
 |
singh.ravee
Yellow Belt

Joined: 12 Aug 2010
Posts: 678
|
Post: #2781  Posted: Mon Aug 15, 2011 10:41 am Post subject: Posted: Mon Aug 15, 2011 10:41 am Post subject: |
 |
|
Casper bhai, hello
as far as my limited knowledge goes, the lower tl in this chart is incorrect.
thanks and regards
ravee
| Description: |
|
| Filesize: |
28.77 KB |
| Viewed: |
425 Time(s) |
|
|
|
| Back to top |
|
 |
casper
Green Belt

Joined: 02 Oct 2010
Posts: 1315
|
Post: #2782  Posted: Mon Aug 15, 2011 10:47 am Post subject: Posted: Mon Aug 15, 2011 10:47 am Post subject: |
 |
|
| singh.ravee wrote: | Casper bhai, hello
as far as my limited knowledge goes, the lower tl in this chart is incorrect.
thanks and regards
ravee |
plz explain paaji, what is wrong here?
|
|
| Back to top |
|
 |
singh.ravee
Yellow Belt

Joined: 12 Aug 2010
Posts: 678
|
Post: #2783  Posted: Mon Aug 15, 2011 11:45 am Post subject: Posted: Mon Aug 15, 2011 11:45 am Post subject: |
 |
|
Casper Bhai,
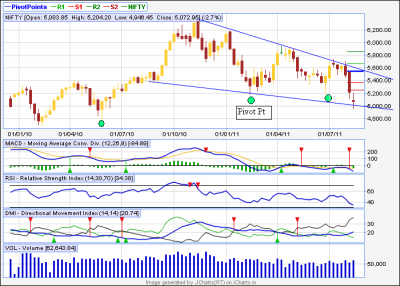
acc to my ltd knowledge a trendline passes through two or more pivot points. in this case only one pivot point is there.
i have tried to mark 2 more pivot points on chart.
thanks and regards
ravee
| Description: |
|
| Filesize: |
40.82 KB |
| Viewed: |
462 Time(s) |
|
|
|
| Back to top |
|
 |
casper
Green Belt

Joined: 02 Oct 2010
Posts: 1315
|
Post: #2784  Posted: Mon Aug 15, 2011 1:15 pm Post subject: Posted: Mon Aug 15, 2011 1:15 pm Post subject: |
 |
|
| singh.ravee wrote: | Casper Bhai,
acc to my ltd knowledge a trendline passes through two or more pivot points. in this case only one pivot point is there.
i have tried to mark 2 more pivot points on chart.
thanks and regards
ravee |
paaji
  
dont worry about that, what u r saying is pivot concept and what i am working with is simply trend lines
yes, if u connect pivots then trend line will be more better, but then u have various strategies to establish them too, which will eventually lead to more confusions
by the way, what i posted is a weekly chart, which most of us , uses only for general guidance purpose, and our trading tf generally remains daily or much lesser tfs, so u dont need be that accurate here
a weekly candle comprises more or less 30 trading hours, its a huge time, hence it is capable to provide huge chance of profit and loss, only peoples who can digest this loss side should consider looking for it
hence, when we take guidance from weekly or monthly chart and virtually super impose that level in our trading tfs, we will be killed if we go by "nominal value" of the support /resi, instead, we deal it much like a "price band" with some +/- corrections, or u can say,as a zone
now under this light, plz try to connect the points u recognized as pivots and then see, around ur pivot point tl, nifty weekly made a long legged dozi
so simply, it got some buying AROUND that zone , means some buying has come and stalled the down move for time being [ other wise, we could go down and down on the day when we made a huge gap down for dow]
now take whatever picture, but we cant deny the buying power around that band, now question is if those buyer were fools or super investors??
time will tell us
i personally strongly believe that we have reason to worry [ in case we are investors] and nifty can head for 4700 and even worse 4000 itself
but at the same time, we have buying going around too, so any thing can happen
[ plz dont mind, but the concept of drawing tls ONLY through pivots, is new to me,  , i have drawn them with high, low, interm. top, interm. bot too, and it worked well in past, that u too know , i have drawn them with high, low, interm. top, interm. bot too, and it worked well in past, that u too know   , so i will say, my stance is "wait and watch"] , so i will say, my stance is "wait and watch"]
|
|
| Back to top |
|
 |
casper
Green Belt

Joined: 02 Oct 2010
Posts: 1315
|
Post: #2785  Posted: Sun Oct 02, 2011 8:26 pm Post subject: Posted: Sun Oct 02, 2011 8:26 pm Post subject: |
 |
|
hi brother rk
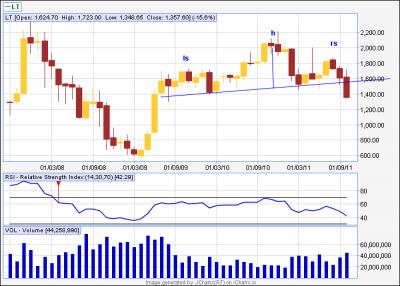
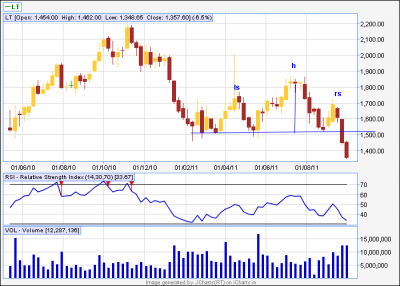
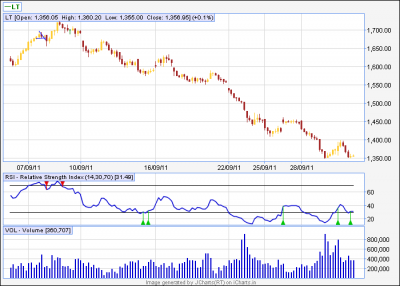
plz see the attached charts, jcharts 1 is 60 min, 2 is weekly and 3 is monthly version, i lack eod, that u posted already

lets start from weekly, see a smaller head and shoulder was developed and eventually broken down, its target can be aprx 1200, (head at 1800 some thing and neck line is at 1500 some thing so target is 1800-1500=300pts, so target price= 1500-300=1200aprx) h/s does not act so good when they form in lower side, in fact it should be at top to be called a true h/s by definition, so we can discount this version too
but bad news is in monthly we see even bigger h/s,that too,on top, so its a live bomb!
here top is at 2200 and neck line is around 1475...say 1500 so below 1500 we have a 700pts downfall at least in theory..... got it?
now these are longer tf charts, it shows down fall and we all know it was falling already, so its nothing new..... a newer thing will be an up move from here,means a total change of trend
if it ever happens then that will be shown in lesser tfs first
so lets see in 60 min for a faster up move
as i mentioned to u already, any upmove will come if there is a divergence in rsi..... almost every time it happens, so lets check for rsi divergence in 60 min
in 60 min price made a low of 1348 and rsi was OS, now next low was 1355, so no lower low has formed yet
thats why i want to see another low below 1348 and then will check rsi for + div, if it comes i hope what u posted will become true
| Description: |
|
| Filesize: |
15.93 KB |
| Viewed: |
429 Time(s) |
|
| Description: |
|
| Filesize: |
17.59 KB |
| Viewed: |
442 Time(s) |
|
| Description: |
|
| Filesize: |
15.58 KB |
| Viewed: |
425 Time(s) |
|
|
|
| Back to top |
|
 |
rk_a2003
Black Belt

Joined: 21 Jan 2010
Posts: 2734
|
Post: #2786  Posted: Sun Oct 02, 2011 8:44 pm Post subject: Posted: Sun Oct 02, 2011 8:44 pm Post subject: |
 |
|
Thank you so much casper!
You not only answered my question ?! Handed over me a Methodology.It's so precious for me.
Thanks a lot.
RK
|
|
| Back to top |
|
 |
casper
Green Belt

Joined: 02 Oct 2010
Posts: 1315
|
Post: #2787  Posted: Sun Oct 02, 2011 9:31 pm Post subject: Posted: Sun Oct 02, 2011 9:31 pm Post subject: |
 |
|
welcome brother
whenever u take a trade in higher tf, such as eod/weekly, always look for divergence in rsi in smaller tfs like 5 ore 60 min
a 5 min div can give u one day long move, which we normally say "unexplained(!!!!) spike within a longer trend"
a 60 min div can go for several days, making them ideal for btst like approach
whereas an eod div or higher tf div means continuing trend is over!!!
|
|
| Back to top |
|
 |
rk_a2003
Black Belt

Joined: 21 Jan 2010
Posts: 2734
|
Post: #2788  Posted: Wed Oct 12, 2011 4:02 pm Post subject: Posted: Wed Oct 12, 2011 4:02 pm Post subject: |
 |
|
Casper!
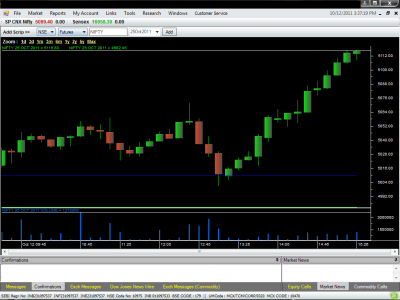
Please find attached Nifty Futures Chart on 10 minute time frame.I request your comments from TA point of view.
There are 14 consecutive green candles which started around 1 p.m and lasted till the end.what does it indicate.( Is it short covering? ).
I keep on watching for the formation of possible -WW in LTF'S but invain. After watching this 10 minute TF I came to know that there is a continuous and comprehensive demand which sucked out all the supply thus no question of ww formation.
Regards
RK
| Description: |
|
| Filesize: |
51.65 KB |
| Viewed: |
437 Time(s) |
|
|
|
| Back to top |
|
 |
casper
Green Belt

Joined: 02 Oct 2010
Posts: 1315
|
Post: #2789  Posted: Wed Oct 12, 2011 5:57 pm Post subject: Posted: Wed Oct 12, 2011 5:57 pm Post subject: |
 |
|
hi brother
first of all, sorry for a late reply, i saw ur post almost when u posted but was very busy
i thought to reply u in details, but it seems that i might remain busy a lil more
so i am pointing out some features
1. presently i have no access to real time stock/index fut chart, so i cant say for sure that it was real buying or a short covering buy, as OI should be seen before taking a call in this regard
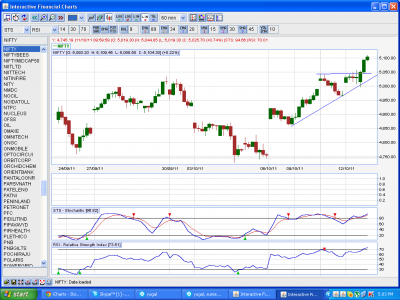
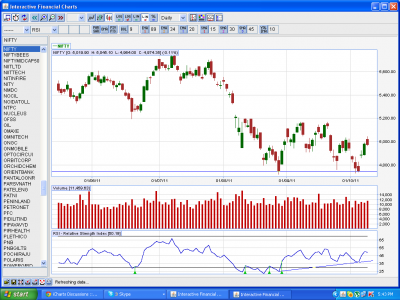
2.for me, the reason of this move was the following two charts
one is real time 60 min chart which gives a target around 5150, which coincidentally the monthly pivot or associated level, (which level exactly that i forgot  ) )
and another chart is eod chart of nifty spot, it shows a divergence in rsi which, i think fueled the upmove and hopefully will take us to 5200 spot
reason of targeting 5200 is
1st.... its a sort of double bottom resistance, which, if cleared, will take us up to 5800-5900
2nd....the presence of gap, which should provide strongest resistance and a fresh chance of sell off from this level, by big shots can not be ruled out
now finally i would say....... well i must admit that i am in deep love with RSI  ...... and thats why i believe, RSI tells every thing first, now going by this idea, i would say the major portion of short covering by big boys already came around 4700 ...... thats why RSI created a div thr and now what we r watching, should be plainly fresh longs ...... and thats why i believe, RSI tells every thing first, now going by this idea, i would say the major portion of short covering by big boys already came around 4700 ...... thats why RSI created a div thr and now what we r watching, should be plainly fresh longs
(personal opinion )
| Description: |
|
| Filesize: |
78.37 KB |
| Viewed: |
437 Time(s) |
|
| Description: |
|
| Filesize: |
75.88 KB |
| Viewed: |
430 Time(s) |
|
|
|
| Back to top |
|
 |
casper
Green Belt

Joined: 02 Oct 2010
Posts: 1315
|
Post: #2790  Posted: Wed Oct 12, 2011 5:59 pm Post subject: Posted: Wed Oct 12, 2011 5:59 pm Post subject: |
 |
|
ps
wrote hurriedly, so if any point is missed or any more explanation is needed, plz feel free to point out
  
|
|
| Back to top |
|
 |
|
|
You cannot post new topics in this forum
You cannot reply to topics in this forum
You cannot edit your posts in this forum
You cannot delete your posts in this forum
You cannot vote in polls in this forum
You can attach files in this forum
You can download files in this forum
|
Powered by phpBB © 2001, 2005 phpBB Group
|
|
|

