|
|
| View previous topic :: View next topic |
| Author |
a layman's approach to break out and break down |
rk_a2003
Black Belt

Joined: 21 Jan 2010
Posts: 2734
|
Post: #2791  Posted: Wed Oct 12, 2011 6:26 pm Post subject: Posted: Wed Oct 12, 2011 6:26 pm Post subject: |
 |
|
Thanks casper! for taking pains to throw some light on it ,eventhough you are really busy.
Now I know your guiding Light in this Deep Dark Stock market is RSI.
I am curious to listen your initial experiences with WW. Tell us when you are really free. 
RK
| casper wrote: | hi brother
first of all, sorry for a late reply, i saw ur post almost when u posted but was very busy
i thought to reply u in details, but it seems that i might remain busy a lil more
so i am pointing out some features
1. presently i have no access to real time stock/index fut chart, so i cant say for sure that it was real buying or a short covering buy, as OI should be seen before taking a call in this regard
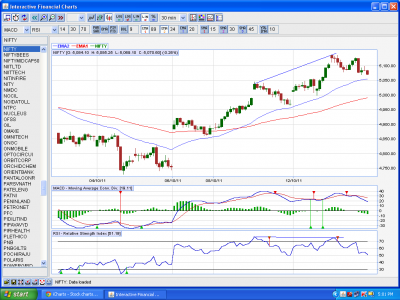
2.for me, the reason of this move was the following two charts
one is real time 60 min chart which gives a target around 5150, which coincidentally the monthly pivot or associated level, (which level exactly that i forgot  ) )
and another chart is eod chart of nifty spot, it shows a divergence in rsi which, i think fueled the upmove and hopefully will take us to 5200 spot
reason of targeting 5200 is
1st.... its a sort of double bottom resistance, which, if cleared, will take us up to 5800-5900
2nd....the presence of gap, which should provide strongest resistance and a fresh chance of sell off from this level, by big shots can not be ruled out
now finally i would say....... well i must admit that i am in deep love with RSI  ...... and thats why i believe, RSI tells every thing first, now going by this idea, i would say the major portion of short covering by big boys already came around 4700 ...... thats why RSI created a div thr and now what we r watching, should be plainly fresh longs ...... and thats why i believe, RSI tells every thing first, now going by this idea, i would say the major portion of short covering by big boys already came around 4700 ...... thats why RSI created a div thr and now what we r watching, should be plainly fresh longs
(personal opinion ) |
|
|
| Back to top |
|
 |
|
|  |
casper
Green Belt

Joined: 02 Oct 2010
Posts: 1315
|
Post: #2792  Posted: Thu Oct 13, 2011 5:08 pm Post subject: Posted: Thu Oct 13, 2011 5:08 pm Post subject: |
 |
|
hii rk
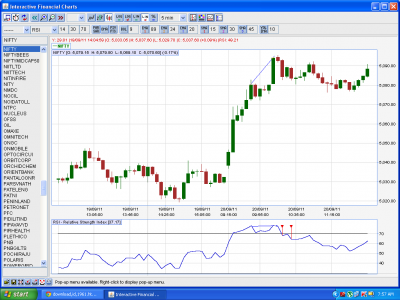
following chart is for u
plz note that u have a red candle on 2nd top, defining that upmove is , atleast temporarily , stopped and top is made, so we r free to judge for divergence
so todays 1st 30 min candle gave that signal and then the fall followed,
now clear what i wanted to say about a red candle, or a hammer/inv hammer or at least a dozi on top????
| Description: |
|
| Filesize: |
75.95 KB |
| Viewed: |
527 Time(s) |

|
|
|
| Back to top |
|
 |
rk_a2003
Black Belt

Joined: 21 Jan 2010
Posts: 2734
|
Post: #2793  Posted: Thu Oct 13, 2011 5:51 pm Post subject: Posted: Thu Oct 13, 2011 5:51 pm Post subject: |
 |
|
Thanks! Casper!
It's clear, and point taken.
|
|
| Back to top |
|
 |
maneesh007
White Belt

Joined: 08 Feb 2009
Posts: 119
|
|
| Back to top |
|
 |
casper
Green Belt

Joined: 02 Oct 2010
Posts: 1315
|
Post: #2795  Posted: Thu Oct 13, 2011 10:49 pm Post subject: Posted: Thu Oct 13, 2011 10:49 pm Post subject: |
 |
|
hiii maneesh bhai
sorry it was not a div actually, but what i understood from ur post is that i need to explain the things in details, ok tomorrow morning i will post about it in details
for now i am giving u some hints
1.check price two highs with simultaneous two indicator highs for - div
2. check two price lows, with simultaneous two indicator lows for + div
in first case.
price will make higher or same highs but indicator will make lower high, showing a bearish undertone in momentum
in second case, price will make lower or same low but indicators will make higher low, showing a bullish undertone
NEVER COMPARE PRICE HIGHS WITH INDICATOR LOW OR INDICATOR HIGHS WITH PRICE LOW AS U DID
tomorrow i will write in details
  
|
|
| Back to top |
|
 |
casper
Green Belt

Joined: 02 Oct 2010
Posts: 1315
|
Post: #2796  Posted: Fri Oct 14, 2011 8:52 am Post subject: Posted: Fri Oct 14, 2011 8:52 am Post subject: |
 |
|
ok maneesh bhai.
here we go, first of all, what is divergence actually??
its a matter of non confirmations, its a matter of extremes, please remember these two line, first of all, it has to be an extreme condition and secondly it will be a non confirmations
in normal market conditions, in a normal move, price and indicator goes hand in hand, if u make a high in price, its likely that indicator will follow price and make a high, if price makes a new low, again its likely that indicator will follow the same with a low too.......... its all about confirmations, but when it does not, trouble starts
and as these kinds of situation starts in extreme market conditions, so a divergence, in indicator's extreme range is a deadly signal, though almost every (almost) indicator can be used to find this kind of "extreme non confirmations" but we will use RSI as it is the simplest and for extreme ranges of RSI, we will use over bought (above 70) or over sold (below 30) levels
now the psychological part, when a market reaches to an extreme, depending upon the nature of the extreme, we, the commoners, normally become either very optimistic or very pessimistic and depending on our emotion , we start taking steps which are emotionally motivated and hardly logical, but in reality, the big guys who are smart enough, start reversing the market, opposite to the public sentiment, as they shift their bets so there comes a change in momentum, now suppose, market is going up and u, me and all like us are extremely bullish but our big boy is setting a stage for a bearish reversal, what will happen??
there will be a non confirmation, in the extreme range, which is a nothing but a divergence, it will show us that the momentum of the market has changed the direction which in turns can be a signal of trend reversal,
please note that a divergence is a signal of changing a momentum, its not necessarily a signal of trend change itself, so although we have a divergence followed by a trend change most of the times, but its not necessarily every time will change the trend, some time it fails too, so we need to use some filter methods ( will write later about it)
divergence can be classified into two broad groups
bullish div and bearish div
depending upon the strength of the momentum change, we can further classify each of them into three sub category
grade A, grade B, and grade C where, grade A stands for best and grade c stands for worst power of divergence
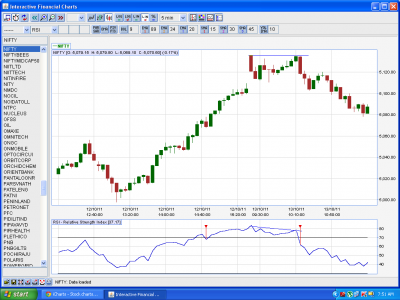
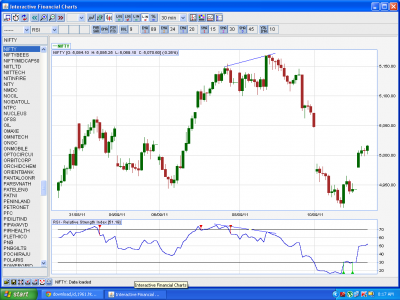
for example, here i am attaching 3 charts of nifty, notice how price made two highs, and always the second high in price was same of 1st high or even higher than that
but in indicators, though that too made two highs, still here the second high was a lower high,
so the situation became as such, price is moving towards 2 o' clock and rsi is moving toward 4 o clock, thus they are not confirming each other, which in turns, making a divergence
all the examples are bearish or negative divergence
| Description: |
|
| Filesize: |
76.07 KB |
| Viewed: |
416 Time(s) |

|
| Description: |
|
| Filesize: |
72.57 KB |
| Viewed: |
504 Time(s) |

|
| Description: |
|
| Filesize: |
71.76 KB |
| Viewed: |
384 Time(s) |

|
|
|
| Back to top |
|
 |
maneesh007
White Belt

Joined: 08 Feb 2009
Posts: 119
|
Post: #2797  Posted: Fri Oct 14, 2011 9:52 am Post subject: Posted: Fri Oct 14, 2011 9:52 am Post subject: |
 |
|
casper bhai,
I don't know ur main profession, but u should be doctor, perfect diagnosis with proper treatment  ...but I need regular checkups ...but I need regular checkups 
God bless u
warm regards
Maneesh Bhardwaj
|
|
| Back to top |
|
 |
vinay28
Black Belt

Joined: 24 Dec 2010
Posts: 11748
|
Post: #2798  Posted: Fri Oct 14, 2011 10:24 am Post subject: Posted: Fri Oct 14, 2011 10:24 am Post subject: |
 |
|
even a doctor needs regular check-ups 
|
|
| Back to top |
|
 |
maneesh007
White Belt

Joined: 08 Feb 2009
Posts: 119
|
Post: #2799  Posted: Fri Oct 14, 2011 10:47 am Post subject: Posted: Fri Oct 14, 2011 10:47 am Post subject: |
 |
|
dear vinay bhai,
At the time of his own checkup, he is patient not a doctor  ... hope u r understanding ... hope u r understanding
|
|
| Back to top |
|
 |
casper
Green Belt

Joined: 02 Oct 2010
Posts: 1315
|
Post: #2800  Posted: Fri Oct 14, 2011 7:35 pm Post subject: Posted: Fri Oct 14, 2011 7:35 pm Post subject: |
 |
|
| maneesh007 wrote: | casper bhai,
I don't know ur main profession, but u should be doctor, perfect diagnosis with proper treatment  ...but I need regular checkups ...but I need regular checkups 
God bless u
warm regards
Maneesh Bhardwaj |
| vinay28 wrote: | even a doctor needs regular check-ups  |
| maneesh007 wrote: | dear vinay bhai,
At the time of his own checkup, he is patient not a doctor  ... hope u r understanding ... hope u r understanding |
hiii
i am a trader..... a fool(!!!!!) time trader..... and nothing else
  
|
|
| Back to top |
|
 |
maneesh007
White Belt

Joined: 08 Feb 2009
Posts: 119
|
Post: #2801  Posted: Fri Oct 14, 2011 8:21 pm Post subject: Posted: Fri Oct 14, 2011 8:21 pm Post subject: |
 |
|
| casper wrote: | | maneesh007 wrote: | casper bhai,
I don't know ur main profession, but u should be doctor, perfect diagnosis with proper treatment  ...but I need regular checkups ...but I need regular checkups 
God bless u
warm regards
Maneesh Bhardwaj |
| vinay28 wrote: | even a doctor needs regular check-ups  |
| maneesh007 wrote: | dear vinay bhai,
At the time of his own checkup, he is patient not a doctor  ... hope u r understanding ... hope u r understanding |
hiii
i am a trader..... a fool(!!!!!) time trader..... and nothing else
   |
casper bhai,
   these 3 fool!!! pegs for u...cheeeers these 3 fool!!! pegs for u...cheeeers 
|
|
| Back to top |
|
 |
vinay28
Black Belt

Joined: 24 Dec 2010
Posts: 11748
|
Post: #2802  Posted: Fri Oct 14, 2011 8:32 pm Post subject: Posted: Fri Oct 14, 2011 8:32 pm Post subject: |
 |
|
Casper, never turn down an offer for a peg and u got three. I will say cheers at my end. Of course I can drink for a friend like you too. 
|
|
| Back to top |
|
 |
casper
Green Belt

Joined: 02 Oct 2010
Posts: 1315
|
Post: #2803  Posted: Fri Oct 14, 2011 8:34 pm Post subject: Posted: Fri Oct 14, 2011 8:34 pm Post subject: |
 |
|
hi rk
hv u ever seen a link in the home page named "calculators"??
go thr and u will see 3 ways of calculations are thr, fib, gan and piv, my long story started when i entered stock market, with a belief that i know all and all i know is enough to conquer the market
  
i did know that there is a chart type called candle stick whr a white candle means price going up and a darker one means going down
i cud utter names of some candlestick patterns though i was yet to know how they look and what they stand for
i heard people saying about trends but did not know what is choppy trend, so u can guess what i knew
my god or my fate drove me here, and by typing "nse candlestick chart" i got this website(ichart) whr i used to look for "candles" and some day, when from net i got the formula for pivot calculation, i bet even general Eisenhower , after knowing that he got atomic weapons in his arsenal, was not happier than me,
in such a situation, i came across that link named "calculators" in those days thr was no "gann" only piv and fib were thr,
now i am a piv expert(!!!) what the hell in the world i need to know more about piv???
so i started playing with fib tool
man!!!
it was a great one, u put high , low and close and it gives u buy/sell, sl and 3 targets
i felt only me in the world knew about it and with help of this "hydrogen bomb", conquering stock market is going to be a cake walk!!
so i started using it actively and some time success and some times failure started accompanying me from then.......
over all, i was impressed and started thinking seriously that why ppls needs real time data? all one could need is high, low and close value and here we go!!!
but things were not easy from 10 to 3.30 in day time either...... some time stocks would open at my target, some time they wont come in the range the holy grail specified for me...... so i had to pay a serious attention to it
and then i came across a strange phenomenon which pays its dividend till today
suppose with my vast(!!!!) knowledge of market, i decided to buy nifty on next day and started calculating the high, low close and got some out puts like
buy at 5001, sl 4990, targets 5020/5030/5040 and next day nifty opened at 5030 instead of opening around 5000...... i noticed that instead of going up, it will go down..... almost every time, and in that case, if i short at 5030, keep some 5-10 pt sl and target 5020/5000/4990 on down side, it becomes a success
same goes for a possible sell and subsequent gap down case.... i would buy and reverse my target and it will be a hit!!
i explained to myself " look man, its like a room, if u open at floor , u will hit ceiling as ur target, and if u open at ceiling.... u hv no whr to go so u will hit the floor"
today with some knowledge of the market, i know if it gaps during opening, its more than likely to develop a div, like a - div if it had a gap up and a + div in case of gap down
yday i posted a chart for u, u saw it opened gap up and developed div and went down like hell...today if u see nifty 5 min, u will see it was a gap down and a + div, and though u guys had a busy day in market as i see in forum..... i bought after first 5 min and kept that
in fact in my office the guys who trade with me have a standing instruction from me " if thr is no hue and cry and still u got a gap, and if im not reachable... then wait for 10 min and if no move is coming in direction of gap go against the gap and short on gap up or buy on gap down"
so what i wanted to tell u, as i already told u, i hv very less exp in WW, but whenever a gap will come, i will check for divergence and most probably will find out and will go with it
for me, gaps (which formed without much hue and cry) are meant for fill up on same day
|
|
| Back to top |
|
 |
maneesh007
White Belt

Joined: 08 Feb 2009
Posts: 119
|
Post: #2804  Posted: Fri Oct 14, 2011 8:42 pm Post subject: Posted: Fri Oct 14, 2011 8:42 pm Post subject: |
 |
|
| vinay28 wrote: | Casper, never turn down an offer for a peg and u got three. I will say cheers at my end. Of course I can drink for a friend like you too.  |
sorry bhai, these are for casper bhai only...btw u can take foool!!! bottle but not these ...cheersssssss to u also   
|
|
| Back to top |
|
 |
vinay28
Black Belt

Joined: 24 Dec 2010
Posts: 11748
|
Post: #2805  Posted: Fri Oct 14, 2011 9:00 pm Post subject: Posted: Fri Oct 14, 2011 9:00 pm Post subject: |
 |
|
Don't worry Manish. I don't snatch other's drink. I drink from my own bottle. 
|
|
| Back to top |
|
 |
|
|
You cannot post new topics in this forum
You cannot reply to topics in this forum
You cannot edit your posts in this forum
You cannot delete your posts in this forum
You cannot vote in polls in this forum
You can attach files in this forum
You can download files in this forum
|
Powered by phpBB © 2001, 2005 phpBB Group
|
|
|

