|
|
| View previous topic :: View next topic |
| Author |
a layman's approach to break out and break down |
casper
Green Belt

Joined: 02 Oct 2010
Posts: 1315
|
Post: #2836  Posted: Sun Oct 16, 2011 9:25 pm Post subject: Posted: Sun Oct 16, 2011 9:25 pm Post subject: |
 |
|
hi peace
this time seriously follow div which is not below OB (though lower high, but 2nd highis not below OB)
follow it for a few times , if u r not confident, then dont trade, just follow it religiously
i hope u will change ur opinion
  
*********** following part i added by editing original post
ohhh , sorry
peace, last time when we talked in SB, now i rem that u told me that u use rsi 80 as OB, if u use 80 as ob then u r right
what i said is about 70/30 settings for ob/os and as per my memory u said that u used 80/20, its a good setting indeed
|
|
| Back to top |
|
 |
|
|  |
peace69
White Belt

Joined: 27 Aug 2009
Posts: 113
|
Post: #2837  Posted: Sun Oct 16, 2011 10:12 pm Post subject: Posted: Sun Oct 16, 2011 10:12 pm Post subject: |
 |
|
| casper wrote: | | chennuru wrote: | Dear Friends,
RSI never mislead you, u have to see the hidden divergence for higher lows in stock and lower lows in RSI,
on every stage it mathes exactly, means follow up of existing trend,
any comments are welcome,
chennuru |
hi, though i know about it, but in real time, it makes me confused, so normally i avoid it and since standard div is enough get desired move, so i dont want to look for hidden divs also
thats why, in my discussion, i kept it out of the picture
(if any one wants to trade it, make sure u dont get confused, its a good tool but for me , it was always confusing one) |
hi casper. wonder if u mean this. attaced r 2 pdf files describing simple div as well as hiden ones. what i experienced so far is div is short term correction to main trend in process to nutralise overstretched mv. once nutralised, main trend continues. although as u mentioned, i too confused to such contra view, attaching 2 pdf files describeing such theory as i've experienced same in real time trading. what i've understood so far is div is a counter trade to main trend. when profitability & success ratio is good, keepinf in mind the intensity of main trend is must. means, if higher tf is just rising from OS zone after considerable dwnmv, failure ratio of - div on lower tf is higher imo. another thing i've noticed is it's not a stand alone ind to trade. it's better to use with other para as set of tradig sys. in strong trend, it gives mny wrong sigs reaching & sustaining in extreme zones. so all in all, it's better to use with other paras with keeping in mind the main trend for short counter trade opportunity. comments & corrections r welcome. regards.
| Description: |
|

Download |
| Filename: |
John Hayden - How To Use The Rsi.pdf |
| Filesize: |
559.77 KB |
| Downloaded: |
497 Time(s) |
Last edited by peace69 on Sun Oct 16, 2011 10:23 pm; edited 1 time in total |
|
| Back to top |
|
 |
peace69
White Belt

Joined: 27 Aug 2009
Posts: 113
|
Post: #2838  Posted: Sun Oct 16, 2011 10:21 pm Post subject: Posted: Sun Oct 16, 2011 10:21 pm Post subject: |
 |
|
| casper wrote: | hi peace
this time seriously follow div which is not below OB (though lower high, but 2nd highis not below OB)
follow it for a few times , if u r not confident, then dont trade, just follow it religiously
i hope u will change ur opinion
  
*********** following part i added by editing original post
ohhh , sorry
peace, last time when we talked in SB, now i rem that u told me that u use rsi 80 as OB, if u use 80 as ob then u r right
what i said is about 70/30 settings for ob/os and as per my memory u said that u used 80/20, its a good setting indeed |
yes casper. u recalled it rightly. it's 80-20. less trades, less whipsaws. prefer to avoid reap on cost of probable rip. by the way. div is one of my fav trade. 
|
|
| Back to top |
|
 |
casper
Green Belt

Joined: 02 Oct 2010
Posts: 1315
|
Post: #2839  Posted: Mon Oct 17, 2011 9:47 am Post subject: Posted: Mon Oct 17, 2011 9:47 am Post subject: |
 |
|
hi all
gap is closed almost
rk......... alryt????
  
|
|
| Back to top |
|
 |
rk_a2003
Black Belt

Joined: 21 Jan 2010
Posts: 2734
|
Post: #2840  Posted: Mon Oct 17, 2011 9:49 am Post subject: Posted: Mon Oct 17, 2011 9:49 am Post subject: |
 |
|
| Yes!
|
|
| Back to top |
|
 |
casper
Green Belt

Joined: 02 Oct 2010
Posts: 1315
|
Post: #2841  Posted: Mon Oct 17, 2011 10:00 am Post subject: Posted: Mon Oct 17, 2011 10:00 am Post subject: |
 |
|
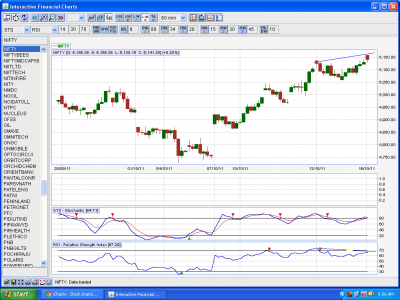
in next 3 min, i mean by the closing of a 60 min candle at 10, thr cud be an opportunity to open a short
see ur charts and decide, plz go by ur methods
| Description: |
|
| Filesize: |
75.18 KB |
| Viewed: |
413 Time(s) |
|
|
|
| Back to top |
|
 |
ridinghood
Yellow Belt

Joined: 16 Apr 2009
Posts: 724
|
Post: #2842  Posted: Mon Oct 17, 2011 10:24 am Post subject: Posted: Mon Oct 17, 2011 10:24 am Post subject: |
 |
|
hi casper brother!
any tgt in mind for nifty shorts?
thnx nd regs
ridinghood
|
|
| Back to top |
|
 |
casper
Green Belt

Joined: 02 Oct 2010
Posts: 1315
|
|
| Back to top |
|
 |
ridinghood
Yellow Belt

Joined: 16 Apr 2009
Posts: 724
|
Post: #2844  Posted: Mon Oct 17, 2011 10:51 am Post subject: Posted: Mon Oct 17, 2011 10:51 am Post subject: |
 |
|
hi casper
thnx for ur quick response as always!
I am ok. thnx. was taking it easy after ..... well u know!
but was always keenly following ur posts.
hope u must be in good spirits! its so nice to have people like u around ready to help people like me !
regs
ridinghood
|
|
| Back to top |
|
 |
casper
Green Belt

Joined: 02 Oct 2010
Posts: 1315
|
Post: #2845  Posted: Mon Oct 17, 2011 11:40 am Post subject: Posted: Mon Oct 17, 2011 11:40 am Post subject: |
 |
|
hi brother
sorry, was digging some crude oil well in between
  
and as i told u in past, when u r not an expert in t.a it shows that u r expert in some thing else which i dont know
like a few months ago, when i was struggling wid my new born website, our ronypan came and msg me in forum saying he is expert in that and he told me that if i face any prb, i could contact him always
i felt honored, its a great feeling actually
  
|
|
| Back to top |
|
 |
casper
Green Belt

Joined: 02 Oct 2010
Posts: 1315
|
Post: #2846  Posted: Wed Oct 19, 2011 3:35 pm Post subject: Posted: Wed Oct 19, 2011 3:35 pm Post subject: |
 |
|
hi ss
its for u
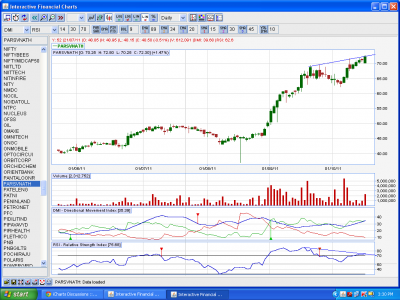
PARSVNATH
rsi falling and price going up, reaching near monthly r1 which will be a good resi
but it is not yet a confirmed div for me
coz
1. last candle is still green, i will wait for a red one
2. distance between two tops are more than 14 candles, so even if red candle appears, it will be a risky short as it is already too wide
| Description: |
|
| Filesize: |
77.03 KB |
| Viewed: |
383 Time(s) |
|
|
|
| Back to top |
|
 |
S.S.
White Belt

Joined: 09 Feb 2011
Posts: 241
|
Post: #2847  Posted: Wed Oct 19, 2011 6:42 pm Post subject: Posted: Wed Oct 19, 2011 6:42 pm Post subject: |
 |
|
| thakx i had a doubt abt time. . . two tops is too wide so i ask u n u cleared it. . . thakx once again . . .can u tell me the reason for 14??
|
|
| Back to top |
|
 |
casper
Green Belt

Joined: 02 Oct 2010
Posts: 1315
|
Post: #2848  Posted: Wed Oct 19, 2011 7:25 pm Post subject: Posted: Wed Oct 19, 2011 7:25 pm Post subject: |
 |
|
just a filter
i dont think its classical approach any way, when saikat sir proposed nvk, he noted it works ONLY in 5 tf (which proved wrong and he worked in higher tf himself) and in he expected that two lows or two highs should appear within 1hr, thus giving a maximum candle range of 12 (12 candles , 5 tf so 60 min)
when i worked on my own, i saw if i stay within my look back period , like here i used rsi 14, so look back period is 14 and i wont trade divs which has more than 14 candles in between, then my success rate is dramatically increases
if i find a div whr distance is more than 14 candles, then i usually refer the immediate higher tf for confirmation,
like i got such a case in 5 tf, then i wud see in 10tf for confirmation
and here i saw that if such large distance cases are confirmed by higher tf divs too, then only they tend to give desired moves
by stating that i dont say that otherwise, any div where distance is more than look back period wont work.....
i just want to say that if it remain within look back period, then success rate is seem to be very high
|
|
| Back to top |
|
 |
S.S.
White Belt

Joined: 09 Feb 2011
Posts: 241
|
Post: #2849  Posted: Wed Oct 19, 2011 9:19 pm Post subject: Posted: Wed Oct 19, 2011 9:19 pm Post subject: |
 |
|
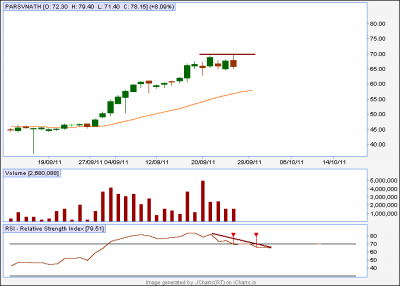
dada what i had seen while viewing the chart is there is two -ve div firtst when there is two tops.
see the chart
| Description: |
|
| Filesize: |
14.52 KB |
| Viewed: |
344 Time(s) |
|
|
|
| Back to top |
|
 |
S.S.
White Belt

Joined: 09 Feb 2011
Posts: 241
|
Post: #2850  Posted: Wed Oct 19, 2011 9:35 pm Post subject: Posted: Wed Oct 19, 2011 9:35 pm Post subject: |
 |
|
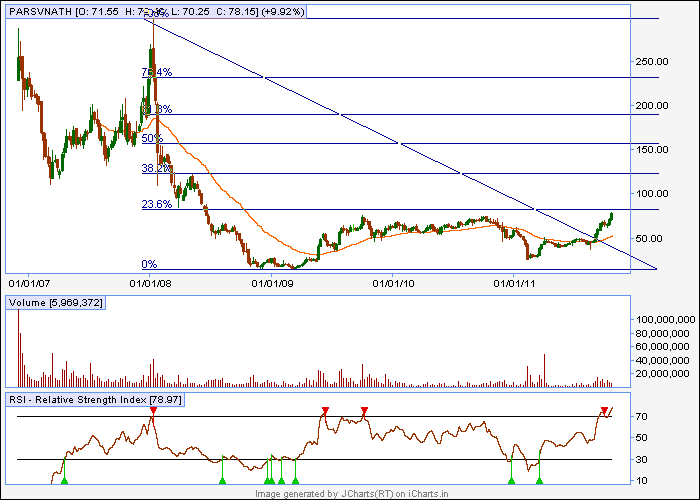
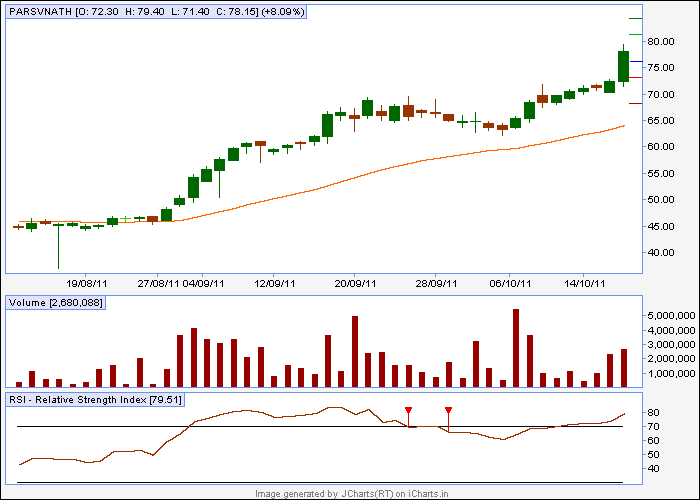
and second what you had posted in fact i mposting the latest by which u can see today it had a good run-up and cross r1 now near r2 infact parsvnath is not intresting to see how it react crossing r2. . . .
coz i thing he gots 3 way pressure
1st its mr2
2nd its veerus number 81  and and
3rd its a 0.23 retracement level.
see both chart. . . . .
| Description: |
|
| Filesize: |
11.54 KB |
| Viewed: |
1896 Time(s) |
|
| Description: |
|
| Filesize: |
6.83 KB |
| Viewed: |
1896 Time(s) |
|
|
|
| Back to top |
|
 |
|
|
You cannot post new topics in this forum
You cannot reply to topics in this forum
You cannot edit your posts in this forum
You cannot delete your posts in this forum
You cannot vote in polls in this forum
You can attach files in this forum
You can download files in this forum
|
Powered by phpBB © 2001, 2005 phpBB Group
|
|
|

