|
|
| View previous topic :: View next topic |
| Author |
a layman's approach to break out and break down |
casper
Green Belt

Joined: 02 Oct 2010
Posts: 1315
|
Post: #286  Posted: Thu Nov 18, 2010 7:07 am Post subject: Re: TTK prestige Posted: Thu Nov 18, 2010 7:07 am Post subject: Re: TTK prestige |
 |
|
| raju87 wrote: | Hi Casper,
Ttkprestige as per charts looks like formation of head and shoulder. Please comment.  |
hi raju87,
as per the eod chart, its making a higher highs and higher lows, its clearly in uptrend, not making h/s.
just to revise, a head and shoulder needs three distinct peaks, among them the middle peak should be higher than the other peaks, and there should be a break down from the neck line that is, the line joining the immediate bottoms of the peaks,
in case of ttk prestige, all the peaks are higher than their previous peak so its in strong uptrend
|
|
| Back to top |
|
 |
|
|  |
casper
Green Belt

Joined: 02 Oct 2010
Posts: 1315
|
Post: #287  Posted: Thu Nov 18, 2010 7:37 am Post subject: Posted: Thu Nov 18, 2010 7:37 am Post subject: |
 |
|
hi vishal.
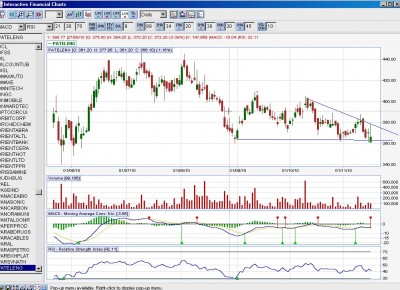
u can sell patel eng if it sustain below 360.350 will be immediate target and if 350 is breached then it will gradually go down to 270 level
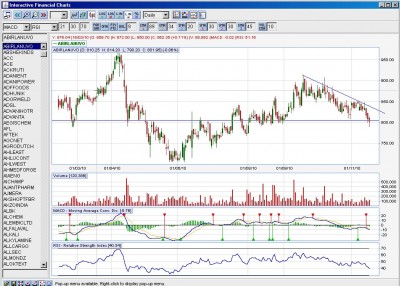
abirlanuvo = if sustained below 800 then very good short, target will be 750, but dont get married with the target brother, just trail ur stop loss
in case of bank baroda. a price channel is broken. now if it sustain here then a target of 900-850 can be achieved, but the bollinger band (20.2) is here in 960 level and it is capable to provide enormous support, so plz sell if 962 with 3% filter say930 is breached, or else price may go up at any time
for ur information. the bollinger band 20.2 is the standard setting of charts(premium) plz take a look there
there is no hard and fast time frame, the target reaching time depends upon the type of pattern and its robustness, historically triangle type patterns reaches their target very fast,some time so fast that u may not be able to take a position if u r not very confident here and cup and handle. saucer h/s generally take longer time
| Description: |
|
| Filesize: |
197.92 KB |
| Viewed: |
318 Time(s) |
|
| Description: |
|
| Filesize: |
203.68 KB |
| Viewed: |
327 Time(s) |
|
|
|
| Back to top |
|
 |
girishhu1
White Belt

Joined: 17 Aug 2009
Posts: 316
|
Post: #288  Posted: Thu Nov 18, 2010 8:52 am Post subject: Posted: Thu Nov 18, 2010 8:52 am Post subject: |
 |
|
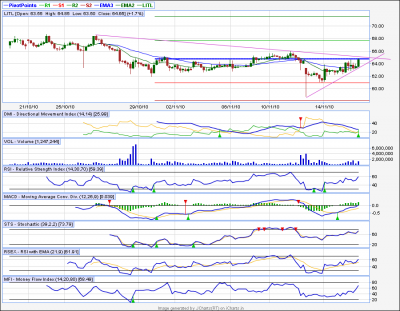
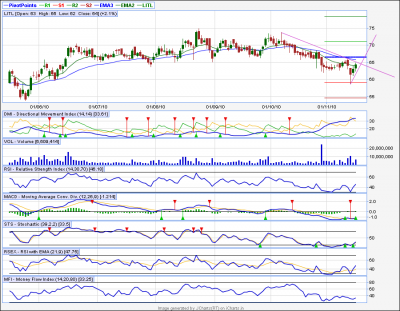
hi casperji,
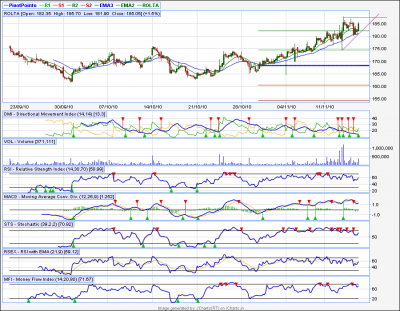
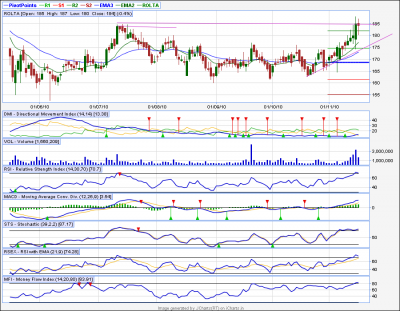
as i am expecting a bounce back i have selected 2 stocks for intra. enlosing daily and intra charts. kindly comment on charts
regards,
girish
| Description: |
|
| Filesize: |
63.46 KB |
| Viewed: |
340 Time(s) |
|
| Description: |
|
| Filesize: |
58.71 KB |
| Viewed: |
326 Time(s) |
|
| Description: |
|
| Filesize: |
53.31 KB |
| Viewed: |
335 Time(s) |
|
| Description: |
|
| Filesize: |
56.87 KB |
| Viewed: |
334 Time(s) |
|
|
|
| Back to top |
|
 |
casper
Green Belt

Joined: 02 Oct 2010
Posts: 1315
|
Post: #289  Posted: Thu Nov 18, 2010 8:54 am Post subject: Posted: Thu Nov 18, 2010 8:54 am Post subject: |
 |
|
| girish bhai, im checking, plz mention time fraem in intra day charts
|
|
| Back to top |
|
 |
casper
Green Belt

Joined: 02 Oct 2010
Posts: 1315
|
|
| Back to top |
|
 |
singh.ravee
Yellow Belt

Joined: 12 Aug 2010
Posts: 678
|
Post: #291  Posted: Thu Nov 18, 2010 5:16 pm Post subject: wrong side Posted: Thu Nov 18, 2010 5:16 pm Post subject: wrong side |
 |
|
dear mr casper,
i took tutorial on candlestick charts for around 6mnths. If u c my papertrade they are more than 80% successful. However, I found whenever, i try to take a trade that trade normally fails. I earn in 2 trades and then a 3 trade backfires and eats away profit of first two trade and some more. I could not figure out why a wonderful papertrade doesnot work in realty. I strongly feel that my observation is appropriate however , i fail in designing an appropriate strategy to undertake the trade. It would be nice on your side if u can share 2-3 imp things to keep in mind for trading in real market.
rgds
ravinder singh.
|
|
| Back to top |
|
 |
newinvestor
White Belt

Joined: 16 Feb 2010
Posts: 120
|
Post: #292  Posted: Thu Nov 18, 2010 5:44 pm Post subject: Re: wrong side Posted: Thu Nov 18, 2010 5:44 pm Post subject: Re: wrong side |
 |
|
| singh.ravee wrote: | dear mr casper,
i took tutorial on candlestick charts for around 6mnths. If u c my papertrade they are more than 80% successful. However, I found whenever, i try to take a trade that trade normally fails. I earn in 2 trades and then a 3 trade backfires and eats away profit of first two trade and some more. I could not figure out why a wonderful papertrade doesnot work in realty. I strongly feel that my observation is appropriate however , i fail in designing an appropriate strategy to undertake the trade. It would be nice on your side if u can share 2-3 imp things to keep in mind for trading in real market.
rgds
ravinder singh. |
Sound almost like my situation. Casper, any guidelines?
Mr. Singh, can you share with us some of your paper trades, for a better understanding?
|
|
| Back to top |
|
 |
casper
Green Belt

Joined: 02 Oct 2010
Posts: 1315
|
Post: #293  Posted: Thu Nov 18, 2010 6:46 pm Post subject: Posted: Thu Nov 18, 2010 6:46 pm Post subject: |
 |
|
hi newinvestor and ravinder singh,(plz call me casper, not mr.casper  ) )
candle stick pattern are particularly good for intraday positions, and that too during consolidation, because during strong trending phase the signal of candle stick will be over ruled easily, again every pattern is not that dependable, during my trading i have found particularly morning star and evening star and to some extent dark cloud cover and rising three/failing three patterns are useful,
again after getting a promising pattern we have to see where it took place, i am a great fan of bollinger band because during my early days of trading this blessed band(!) has ruined my day on numerous occasion, then only i came to know its power and use it in my favour.
if u find a morning star at the top level of bollinger band or an evening star at the bottom the bb, then better avoid it because the reversal which would otherwise happen, would be chocked by bb.
in fact in this stock market, there are lot of ways to loose, winning ways may be fewer but they do exists. so in order to know where the problem is, we need to go through ur failed trades, plz make it a point to post ur past failures, so that i can guess some thing about the problem.
we need a strategy to follow strictly, if u dont mind, this will not drop from the sky,but have to be developed out of our needs.we have to analyze our trades, our reactions to the market movements, but above all we need a profitable strategy to follow, with out this, we will be done.
if we start buying at resistance and sell at support and claim that this is our style of trading, then may the god bless us
may be two days ago, i got a post of one of my brothers,who could not book the profitable position and expected more profit and in the mean time market crashed. let us not take it lightly, this things happens, he was right in his decision to enter the trade, but was wrong to stay too long.
take my example, in mid 2009, i bought call option of bhartiairtel for 2 rupees and hold it upto 14 rupees and still waited, only to square up at 50 paise.
now i cant say that i was a failure as an analyst to enter that trade, it could be profitable, but i was a big zero as a trader. so there could be human mistakes in an otherwise profitable strategy, we have to eradicate most of the loop holes one by one in order to become successful, if u think that i can be useful to eradicate the loop holes, then just USE ME.
at the earliest, plz post ur failure trades and let me know what is ur time horizon and if u think u need my views ( i am certainly not an expert, just another trader like u) u can post me stocks on which u are planning to take position. 
|
|
| Back to top |
|
 |
singh.ravee
Yellow Belt

Joined: 12 Aug 2010
Posts: 678
|
Post: #294  Posted: Thu Nov 18, 2010 6:53 pm Post subject: Posted: Thu Nov 18, 2010 6:53 pm Post subject: |
 |
|
thank you so much for your guidance
rgds
ravinder singh.
|
|
| Back to top |
|
 |
newinvestor
White Belt

Joined: 16 Feb 2010
Posts: 120
|
Post: #295  Posted: Thu Nov 18, 2010 8:01 pm Post subject: Posted: Thu Nov 18, 2010 8:01 pm Post subject: |
 |
|
| Casper, just going thru the intra day chart for Nifty, it looks like an ascending triangle. Any thoughts? Can we expect a B/O above 6040 tomorrow?
|
|
| Back to top |
|
 |
casper
Green Belt

Joined: 02 Oct 2010
Posts: 1315
|
Post: #296  Posted: Thu Nov 18, 2010 8:25 pm Post subject: Posted: Thu Nov 18, 2010 8:25 pm Post subject: |
 |
|
i dont have intra day future data, im basic member 
as per as the cash data is concerned, it is an ascending triangle in almost every tf from 5 min to 60 min,we can get a target of 6050-6075 if it sustained above 6000.
but then, if we get a gap up, then it may open at the target level and finish the prospect
|
|
| Back to top |
|
 |
newinvestor
White Belt

Joined: 16 Feb 2010
Posts: 120
|
Post: #297  Posted: Thu Nov 18, 2010 9:54 pm Post subject: Posted: Thu Nov 18, 2010 9:54 pm Post subject: |
 |
|
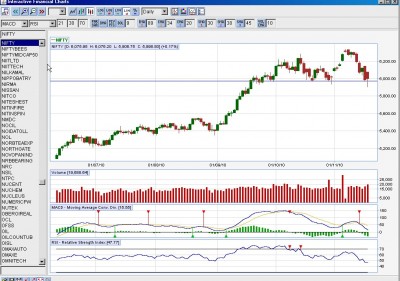
Casper, I am just learning this, but on JCharts (EOD), Nifty looks to be making a Head and shoulder , with the left shoulder and head already formed, with the neckline slightly below 6000.
If correct, then the expected breakout tomorrow above the ascending triangle should have a target of around 6200, which was the height of the left shoulder.
Can you pls check it out and comment?
|
|
| Back to top |
|
 |
measoldier
White Belt

Joined: 09 Sep 2010
Posts: 36
|
Post: #298  Posted: Thu Nov 18, 2010 10:21 pm Post subject: For friendly ghost :-)casper:-) Posted: Thu Nov 18, 2010 10:21 pm Post subject: For friendly ghost :-)casper:-) |
 |
|
Hi casper
i have taken position in voltas future at 254 as it bounced back from 248 many times and looks like a lot of demand for it at this level as it was a previous resistance.it closed at 254. Just want to confirm that should i hold it long till expiry or should exit at opening tomorrow? Lot size is 1000. Pls guide.
|
|
| Back to top |
|
 |
casper
Green Belt

Joined: 02 Oct 2010
Posts: 1315
|
Post: #299  Posted: Thu Nov 18, 2010 10:31 pm Post subject: Posted: Thu Nov 18, 2010 10:31 pm Post subject: |
 |
|
at this stage this is not head and shoulder as from this chart, we dont get any assurance that the right shoulder will form for sure,it can break from here, at least for the sake of discussion, we can expect a break from here, in that case, it will be a broadening top/megaphone top pattern
if and only if it takes support of the trend line and goes up but does not cross the peak u called the head and again comes down to this level and breaks from this trend line, then only it will be a h/s
in case if it takes support from the trend line now and goes up and crosses the previous high, then it will resume its up trend
plz remember that h/s gives break downs, never take such chart pattern, which are in intermediate form of h/s as a break out, as their is no guarantee of up move (plz dont bring the idea of intra day ascending triangle here. this ascending triangle is supposed to give bo, but this case is entirely different from that one)
| Description: |
|
| Filesize: |
175.37 KB |
| Viewed: |
345 Time(s) |
|
|
|
| Back to top |
|
 |
casper
Green Belt

Joined: 02 Oct 2010
Posts: 1315
|
Post: #300  Posted: Thu Nov 18, 2010 10:45 pm Post subject: Posted: Thu Nov 18, 2010 10:45 pm Post subject: |
 |
|
i think it can go up to 260 levels, i hope tomorrow it should reach at least 256 levels, if u see a gap up and then going down, then u may think about selling, or else, i hope it will go smoothly
(as per cash data i wrote this, cash closing is 252, future chart is not available now, so in case of 256 case price, u may need to add the premium to get the future price)
|
|
| Back to top |
|
 |
|
|
You cannot post new topics in this forum
You cannot reply to topics in this forum
You cannot edit your posts in this forum
You cannot delete your posts in this forum
You cannot vote in polls in this forum
You can attach files in this forum
You can download files in this forum
|
Powered by phpBB © 2001, 2005 phpBB Group
|
|
|

