|
|
| View previous topic :: View next topic |
| Author |
a layman's approach to break out and break down |
casper
Green Belt

Joined: 02 Oct 2010
Posts: 1315
|
Post: #2851  Posted: Thu Oct 20, 2011 8:45 am Post subject: Posted: Thu Oct 20, 2011 8:45 am Post subject: |
 |
|
hi shaumik
see the two divs u posted
in first case, u had a red candle on top and distance between two tops was within look back period, (parsvnath111 chart)
here u had a fall, though smaller, but a fall, and in fact during a strong trend in place, we can not expect any thing more than that from a div case as div is not suppossed to be used in trending market
in the second case, u hv no red candle in 2nd top and distance between the two tops are wider enough
so simply, 2nd div case did not produced any result as expected,
and as for resistance, yes , presence of multiple resi is a factor, but levels forms for breaking, so if they too broken, it will hv more upside
by the way, whenever u face this kinds of stronger trend in eod, always wait for a div in weekly tf for meaningful move contra to the trend
|
|
| Back to top |
|
 |
|
|  |
S.S.
White Belt

Joined: 09 Feb 2011
Posts: 241
|
Post: #2852  Posted: Thu Oct 20, 2011 8:50 am Post subject: Posted: Thu Oct 20, 2011 8:50 am Post subject: |
 |
|
| got ur point
|
|
| Back to top |
|
 |
singh.ravee
Yellow Belt

Joined: 12 Aug 2010
Posts: 678
|
|
| Back to top |
|
 |
rk_a2003
Black Belt

Joined: 21 Jan 2010
Posts: 2734
|
Post: #2854  Posted: Tue Oct 25, 2011 8:04 pm Post subject: Posted: Tue Oct 25, 2011 8:04 pm Post subject: |
 |
|
Casper!
May I request a commentory of todays upmove from you....... in case you find any......and if possible.
|
|
| Back to top |
|
 |
S.S.
White Belt

Joined: 09 Feb 2011
Posts: 241
|
Post: #2855  Posted: Tue Oct 25, 2011 8:41 pm Post subject: Posted: Tue Oct 25, 2011 8:41 pm Post subject: |
 |
|
| singh.ravee wrote: | casper bhai,
hello. 
A high volume breakout in mnf hourly from AT.
Hope to see 5300 = upper end of gap.
Thanks and Regards
Ravee |
hello ravee paji
sorry i jumped in between.... in my view we have to wait till friday close ..... what do u think paji????
|
|
| Back to top |
|
 |
casper
Green Belt

Joined: 02 Oct 2010
Posts: 1315
|
Post: #2856  Posted: Wed Oct 26, 2011 9:04 am Post subject: Posted: Wed Oct 26, 2011 9:04 am Post subject: |
 |
|
hi paaji,rk and ss
sorry, yday i could not reply u
first of all, i would say i have missed it and was in comm, so now after seeing ur post im checking it and finding out what was the reason for such a move
it was derived by the RBI, but if we see the charts, then we will find out that chart did tell u in well advance that some thing was going to happen
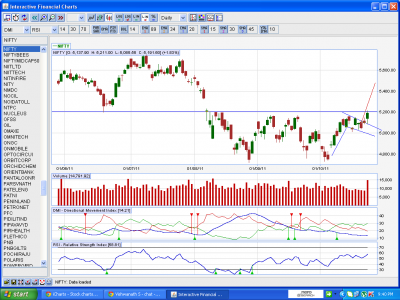
first of all, look at the eod flag, it is broken out with high volume yday, here, target could be aprx 5500
as u can see in the chart i posted, that there is still a parallel trend line and we closed just below that tl, so we must break it and sustain above that in order to go ahead,
and if we do that, then there will be a double bottom break out which should give a move of 400pts upside
(5200 the highs-4800 the lows=400 target)
now if we check in the real time versions, we will see that always market showed up some bullish signs and then moved ahead
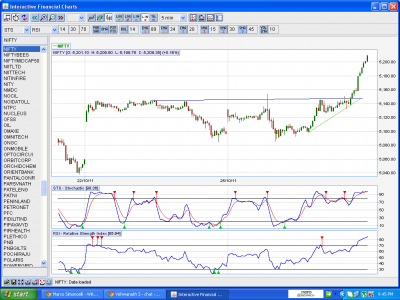
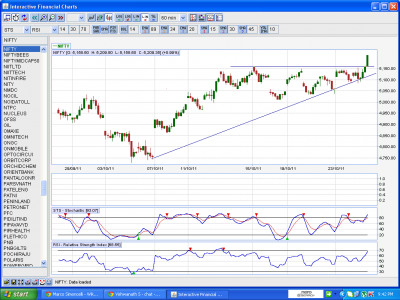
i am attaching two charts, one is of 5 min and another is of 60 min tf (60 min one is already posted by ravee paaji)
in those charts we can clearly see that ,at first in 5tf it was like a double bot or we can say a small at too which broken out nicely
and in 60 min version , it was an at which formed over the last couple of days and today, during final hours, its broken out too
so ryt now the situation is , we had some bullish set ups and we nicely broken out too but in eod we are yet to break a level and closed just below that
so we need to be watchful,if that eod double bot resi were not there, we could start full fledged buying but since we have another level to clear, so lets wait and watch
  
| Description: |
|
| Filesize: |
74.24 KB |
| Viewed: |
408 Time(s) |
|
| Description: |
|
| Filesize: |
78.03 KB |
| Viewed: |
430 Time(s) |
|
| Description: |
|
| Filesize: |
78.22 KB |
| Viewed: |
453 Time(s) |
|
|
|
| Back to top |
|
 |
sandew
White Belt

Joined: 02 Feb 2009
Posts: 174
|
Post: #2857  Posted: Wed Oct 26, 2011 10:43 am Post subject: Nifty expiry Posted: Wed Oct 26, 2011 10:43 am Post subject: Nifty expiry |
 |
|
| Well put, Casper - a wall at 5200 still to surmount.
|
|
| Back to top |
|
 |
casper
Green Belt

Joined: 02 Oct 2010
Posts: 1315
|
Post: #2858  Posted: Wed Oct 26, 2011 3:49 pm Post subject: Posted: Wed Oct 26, 2011 3:49 pm Post subject: |
 |
|
thanks sandew
  
|
|
| Back to top |
|
 |
casper
Green Belt

Joined: 02 Oct 2010
Posts: 1315
|
|
| Back to top |
|
 |
S.S.
White Belt

Joined: 09 Feb 2011
Posts: 241
|
Post: #2860  Posted: Wed Oct 26, 2011 4:23 pm Post subject: Posted: Wed Oct 26, 2011 4:23 pm Post subject: |
 |
|
| happy diwali and a happy new year to all IChartians
|
|
| Back to top |
|
 |
maneesh007
White Belt

Joined: 08 Feb 2009
Posts: 119
|
Post: #2861  Posted: Wed Oct 26, 2011 4:40 pm Post subject: Posted: Wed Oct 26, 2011 4:40 pm Post subject: |
 |
|
Hi casper bhai & all Ichartians,
A very very Happy Deepawali to you & your family...
Warm regards
Maneesh Bhardwaj
| Description: |
|
| Filesize: |
119.79 KB |
| Viewed: |
423 Time(s) |

|
|
|
| Back to top |
|
 |
rk_a2003
Black Belt

Joined: 21 Jan 2010
Posts: 2734
|
Post: #2862  Posted: Fri Oct 28, 2011 9:22 pm Post subject: Posted: Fri Oct 28, 2011 9:22 pm Post subject: |
 |
|
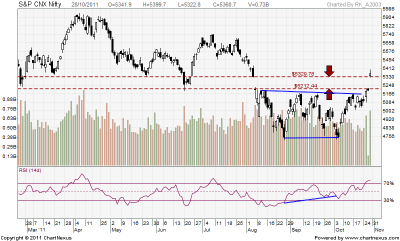
Nifty Filled up the gap down it made on 5-8-2011.During these 3 months this gap acted as an effective resistance for 4 times, on 5th attempt it jumped up and filled that gap.
If it is able to survive above this gap for a couple of days.This gap may effectively serve as a strong support in near future.
Then can We take long positions with a stop loss just below it?!. For a Target of 5500 and then 5700.
| Description: |
|
| Filesize: |
30.88 KB |
| Viewed: |
429 Time(s) |
|
|
|
| Back to top |
|
 |
S.S.
White Belt

Joined: 09 Feb 2011
Posts: 241
|
Post: #2863  Posted: Fri Oct 28, 2011 10:33 pm Post subject: Posted: Fri Oct 28, 2011 10:33 pm Post subject: |
 |
|
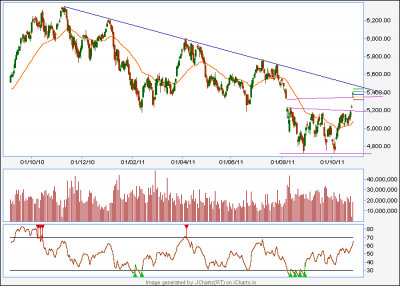
| rk_a2003 wrote: | Nifty Filled up the gap down it made on 5-8-2011.During these 3 months this gap acted as an effective resistance for 4 times, on 5th attempt it jumped up and filled that gap.
If it is able to survive above this gap for a couple of days.This gap may effectively serve as a strong support in near future.
Then can We take long positions with a stop loss just below it?!. For a Target of 5500 and then 5700. |
rk what u r showing in the chart is island reversal pattern i m not sure abt the sucsess ratio of the pattern. . . .though casper can speak better abt the pattern. . how reliable it is n what is the ratio of success in detail. as per pattern 5550 could be the possible target but we should watch out the trend line from top.5450 could be the resistance in short term ...will see what will happend in next weel ...
| Description: |
|
| Filesize: |
13.65 KB |
| Viewed: |
482 Time(s) |
|
|
|
| Back to top |
|
 |
casper
Green Belt

Joined: 02 Oct 2010
Posts: 1315
|
Post: #2864  Posted: Fri Oct 28, 2011 10:44 pm Post subject: Posted: Fri Oct 28, 2011 10:44 pm Post subject: |
 |
|
hi maneesh bhai, thanks and welcome
  
hi rk
a contra view
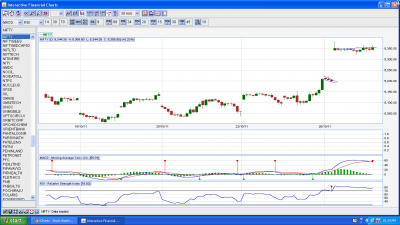
see this, stage is ready, one gap up on monday followed by a red candle in 30 min spot chart, we have clear divergence
though there is no guarantee that we will make a red candle in 30 min tf in first 30 min, but even if it does what that would tell us??
two possibilities are there even if it gives a divergence
1st, div came and we fall
it will be bad news for our bears now turned bulls, bcoz they lost in shorting and will get another shock in long trades too
(plz rem rk, div only works in range bound market, so if div comes and we fall, it will show that we r still in range, so no new trend came....... quite shocking, wont be it???)
2nd
div came and we did not fall much and we start pulling up again
a good sign for bulls, then it will clearly show that new trend is in market, thats why div did not worked as expected and ur upside targets will be reached without much problems
   
| Description: |
|
| Filesize: |
77.3 KB |
| Viewed: |
483 Time(s) |
|
|
|
| Back to top |
|
 |
casper
Green Belt

Joined: 02 Oct 2010
Posts: 1315
|
Post: #2865  Posted: Fri Oct 28, 2011 10:51 pm Post subject: Posted: Fri Oct 28, 2011 10:51 pm Post subject: |
 |
|
hi ss
yes , even if we dont fall due to a div as i wrote in prev post, still all longs for now should be aimed at that down trendline, and only after breaking that down tl, we will have some respite
before that expect last attack of bear around that tl
as for island reversal
i read about it but i have no personal exp of trading them, (simply bcoz they are so rare)
so i hope for the best
  
|
|
| Back to top |
|
 |
|
|
You cannot post new topics in this forum
You cannot reply to topics in this forum
You cannot edit your posts in this forum
You cannot delete your posts in this forum
You cannot vote in polls in this forum
You can attach files in this forum
You can download files in this forum
|
Powered by phpBB © 2001, 2005 phpBB Group
|
|
|

