|
|
| View previous topic :: View next topic |
| Author |
a layman's approach to break out and break down |
rk_a2003
Black Belt

Joined: 21 Jan 2010
Posts: 2734
|
Post: #2881  Posted: Wed Nov 02, 2011 4:07 pm Post subject: Posted: Wed Nov 02, 2011 4:07 pm Post subject: |
 |
|
| OK! Got it.Thanks! Casper.
|
|
| Back to top |
|
 |
|
|  |
rk_a2003
Black Belt

Joined: 21 Jan 2010
Posts: 2734
|
Post: #2882  Posted: Sat Nov 05, 2011 9:40 pm Post subject: Posted: Sat Nov 05, 2011 9:40 pm Post subject: |
 |
|
Casper
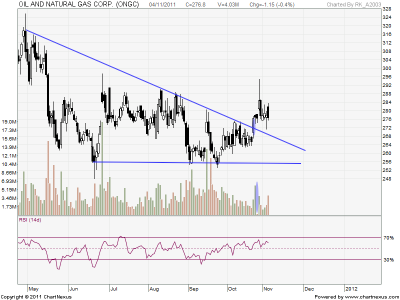
Please see the attached Chart of ONGC(EOD). I see a desc.triangle formation and it appears that it took a break out in opposite direction therefore a failed one.
In case you found any thing worth commenting...... please .
| Description: |
|
| Filesize: |
36.16 KB |
| Viewed: |
411 Time(s) |

|
|
|
| Back to top |
|
 |
singh.ravee
Yellow Belt

Joined: 12 Aug 2010
Posts: 678
|
Post: #2883  Posted: Sun Nov 06, 2011 9:23 am Post subject: Posted: Sun Nov 06, 2011 9:23 am Post subject: |
 |
|
| rk_a2003 wrote: |
Please see the attached Chart of ONGC(EOD). I see a desc.triangle formation and it appears that it took a break out in opposite direction therefore a failed one. |
rk_a2003,
hi, to me its not a DT as volume is not falling uniformly.
rgds
ravee
|
|
| Back to top |
|
 |
casper
Green Belt

Joined: 02 Oct 2010
Posts: 1315
|
|
| Back to top |
|
 |
rk_a2003
Black Belt

Joined: 21 Jan 2010
Posts: 2734
|
Post: #2885  Posted: Sun Nov 06, 2011 3:04 pm Post subject: Posted: Sun Nov 06, 2011 3:04 pm Post subject: |
 |
|
Casper
I love to be a Rebel 
Reason - This World is Upside Down and to be a Rebel is a rational way to see it properly (and make it proper too).
Therefore your suggestion is very well in tune with my outlook.
Thanks!
RK
|
|
| Back to top |
|
 |
S.S.
White Belt

Joined: 09 Feb 2011
Posts: 241
|
|
| Back to top |
|
 |
casper
Green Belt

Joined: 02 Oct 2010
Posts: 1315
|
Post: #2887  Posted: Mon Nov 07, 2011 11:26 am Post subject: Posted: Mon Nov 07, 2011 11:26 am Post subject: |
 |
|
ok saumik, replying one by one here
1. u can buy even above 105, for a target of 110 then after 110, u can buy some more
above 110 it should go up for 15-18 rs more
2. if it reaches there, then it will be around 125-130 range, which will make a proper rounding bottom,
3. if in future it sustain above 135 too, then there is a possibility for going up for another 40-50 rs from 135 range, for a rounding bottom break out
4.u can keep 105 as sl, no problem, normally i keep "a candle close below the break out level" as sl, as i follow it "by closing" so i hardly have my sl hit, but at the same time, i run into the risk of paying more if it ever it hits
(simply bcoz u cant help but to wait for a close even if it is going down), so here, choice is urs.
5. finally, the green line is not a divergence, here stock and rsi both are going up, hence no divergence
(some ppls follow "hidden divergence" concept, i am not familiar with it and for me its still confusing, so cant say if its any form of hidden div or not, but its not a regular div for sure, and it does not shows any chance of major fall as of now, form eod chart at least)
and here is my (un)registered trade mark
  
|
|
| Back to top |
|
 |
S.S.
White Belt

Joined: 09 Feb 2011
Posts: 241
|
Post: #2888  Posted: Mon Nov 07, 2011 2:44 pm Post subject: Posted: Mon Nov 07, 2011 2:44 pm Post subject: |
 |
|
| thank u dada...but still not clear abt the divergence
|
|
| Back to top |
|
 |
S.S.
White Belt

Joined: 09 Feb 2011
Posts: 241
|
Post: #2889  Posted: Mon Nov 07, 2011 3:34 pm Post subject: Posted: Mon Nov 07, 2011 3:34 pm Post subject: |
 |
|
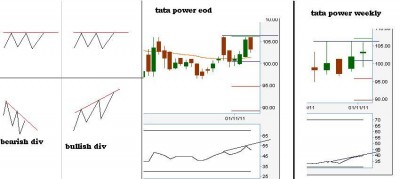
sorry casper but once again i m posting tata power
first drawing ia bearish n 2nd is bullish div is it correct ???? (if no then plz explain it)
if yes then there is two chart tatapower daily n weekly why cant we consider it as divergence????
| Description: |
|
| Filesize: |
39.24 KB |
| Viewed: |
412 Time(s) |

|
|
|
| Back to top |
|
 |
casper
Green Belt

Joined: 02 Oct 2010
Posts: 1315
|
Post: #2890  Posted: Tue Nov 08, 2011 8:49 am Post subject: Posted: Tue Nov 08, 2011 8:49 am Post subject: |
 |
|
saumik
a big mistake u r committing
in ur chart, what u marked as a bullish div is not at all a bullish div, bcoz in bullish divs u consider BOTTOMS, and in bearish div, u consider TOPS, so, ur bullish div cant be valid any way as u considered tops and saying its bullish, hence weekly div that u posted as bullish is not valid
secondly
we look at div in EXTREMES
for bullish div, its a sort of mandatory to look for div when rsi is OS
for bearish div , it should be OB,
if u cant find OB/OS still u have to be near that range like looking for bullish one around rsi 30 but not above , say 35
and looking for bearish one around rsi 70 but not below 65 or so
(though i personally follow OB/OS rule RELIGIOUSLY)
hence, the chart u marked as bearish in daily is not at all bearish in this tf as rsi is much lower than 70
to have a safe journey, never look for div when rsi is not OB/OS
by the way, if u look at the tata power in smaller real time charts like 5 to 60 min charts, u may find some div there, i hv not checked, but it looks like...
but try to make sure that rsi MUST BE ob/os when u find a div
|
|
| Back to top |
|
 |
casper
Green Belt

Joined: 02 Oct 2010
Posts: 1315
|
|
| Back to top |
|
 |
S.S.
White Belt

Joined: 09 Feb 2011
Posts: 241
|
Post: #2892  Posted: Tue Nov 08, 2011 10:24 am Post subject: Posted: Tue Nov 08, 2011 10:24 am Post subject: |
 |
|
| casper wrote: | saumik
in ur chart, what u marked as a bullish div is not at all a bullish div, bcoz in bullish divs u consider BOTTOMS, and in bearish div, u consider TOPS, so, ur bullish div cant be valid any way as u considered tops and saying its bullish, hence weekly div that u posted as bullish is not valid
|
ok thankx a lot....
|
|
| Back to top |
|
 |
ronypan
White Belt

Joined: 07 Aug 2010
Posts: 197
|
Post: #2893  Posted: Tue Nov 08, 2011 11:53 am Post subject: Posted: Tue Nov 08, 2011 11:53 am Post subject: |
 |
|
| S.S. wrote: | sorry casper but once again i m posting tata power
first drawing ia bearish n 2nd is bullish div is it correct ???? (if no then plz explain it)
if yes then there is two chart tatapower daily n weekly why cant we consider it as divergence???? |
...
@S.S
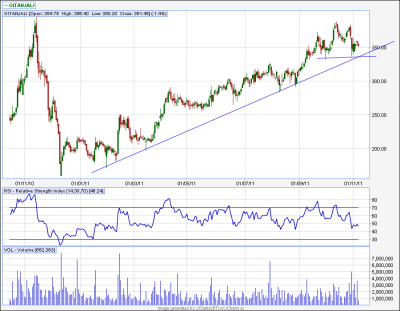
GITANJALI... -DIV..
I THINK THIS WAY... IT IS CORRECT ONE..
I AM ALSO LEARNING...
IS IT CORRECT, CASPER?
| Description: |
|
| Filesize: |
130.27 KB |
| Viewed: |
348 Time(s) |

|
|
|
| Back to top |
|
 |
codered
White Belt

Joined: 03 Nov 2011
Posts: 71
|
Post: #2894  Posted: Tue Nov 08, 2011 12:00 pm Post subject: Posted: Tue Nov 08, 2011 12:00 pm Post subject: |
 |
|
Vinst are you alive? 
|
|
| Back to top |
|
 |
sumesh_sol
Brown Belt

Joined: 06 Jun 2010
Posts: 2344
|
Post: #2895  Posted: Tue Nov 08, 2011 1:04 pm Post subject: Posted: Tue Nov 08, 2011 1:04 pm Post subject: |
 |
|
| ronypan wrote: | | S.S. wrote: | sorry casper but once again i m posting tata power
first drawing ia bearish n 2nd is bullish div is it correct ???? (if no then plz explain it)
if yes then there is two chart tatapower daily n weekly why cant we consider it as divergence???? |
...
@S.S
GITANJALI... -DIV..
I THINK THIS WAY... IT IS CORRECT ONE..
I AM ALSO LEARNING...
IS IT CORRECT, CASPER? |
With Casper bhai's anticipated approval, I'm answering this 
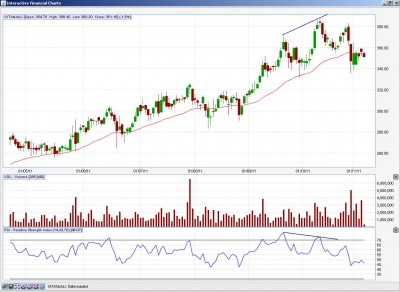
Rony, with my limited TA , I can say div. do not indicate meaningful information in strong trending conditions... If you see attached chart you will find that RSI is hovering on overbought area for quite some time and prices are in steep uptrend. So in my view, it is better if price break TL and trade below that for 2-3 days, then we can have some indication of its downward journey. Also, if u notice there is one H&S pattern appearing at the top, which coincide with TL break...
Regards,
Sumesh
| Description: |
|
| Filesize: |
32.84 KB |
| Viewed: |
367 Time(s) |

|
|
|
| Back to top |
|
 |
|
|
You cannot post new topics in this forum
You cannot reply to topics in this forum
You cannot edit your posts in this forum
You cannot delete your posts in this forum
You cannot vote in polls in this forum
You can attach files in this forum
You can download files in this forum
|
Powered by phpBB © 2001, 2005 phpBB Group
|
|
|

