| View previous topic :: View next topic |
| Author |
a layman's approach to break out and break down |
ronypan
White Belt

Joined: 07 Aug 2010
Posts: 197
|
Post: #2896  Posted: Tue Nov 08, 2011 1:16 pm Post subject: Posted: Tue Nov 08, 2011 1:16 pm Post subject: |
 |
|
| sumesh_sol wrote: | | ronypan wrote: | | S.S. wrote: | sorry casper but once again i m posting tata power
first drawing ia bearish n 2nd is bullish div is it correct ???? (if no then plz explain it)
if yes then there is two chart tatapower daily n weekly why cant we consider it as divergence???? |
...
@S.S
GITANJALI... -DIV..
I THINK THIS WAY... IT IS CORRECT ONE..
I AM ALSO LEARNING...
IS IT CORRECT, CASPER? |
With Casper bhai's anticipated approval, I'm answering this 
Rony, with my limited TA , I can say div. do not indicate meaningful information in strong trending conditions... If you see attached chart you will find that RSI is hovering on overbought area for quite some time and prices are in steep uptrend. So in my view, it is better if price break TL and trade below that for 2-3 days, then we can have some indication of its downward journey. Also, if u notice there is one H&S pattern appearing at the top, which coincide with TL break...
Regards,
Sumesh |
Thanks Sumesh for Explaining..
|
|
| Back to top |
|
 |
|
|
 |
ronypan
White Belt

Joined: 07 Aug 2010
Posts: 197
|
Post: #2897  Posted: Tue Nov 08, 2011 1:34 pm Post subject: Posted: Tue Nov 08, 2011 1:34 pm Post subject: |
 |
|
@Sumesh,
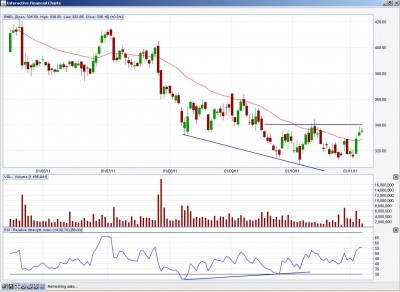
Can we buy BHEL Above 340 for the target of 360.?
| Description: |
|
| Filesize: |
130 KB |
| Viewed: |
417 Time(s) |
|
|
|
| Back to top |
|
 |
sumesh_sol
Brown Belt

Joined: 06 Jun 2010
Posts: 2344
|
Post: #2898  Posted: Tue Nov 08, 2011 2:12 pm Post subject: Posted: Tue Nov 08, 2011 2:12 pm Post subject: |
 |
|
| ronypan wrote: | @Sumesh,
Can we buy BHEL Above 340 for the target of 360.? |
Hi Rony, I'm not sure on what basis u r assuming a buy signal.. Because from a downtrend a buy signal can emmerge if there is an INVERSE H&S (there are many other indications also), and here actually it is a H&S which has no use for upmove.. In fact, H&S if formed at the top of the rally then they are best indications for downtrend, and likewise inverse H&S are best used at the end of a rally...
Casper can through some more light into it..
Regards,
Sumesh
|
|
| Back to top |
|
 |
S.S.
White Belt

Joined: 09 Feb 2011
Posts: 241
|
Post: #2899  Posted: Tue Nov 08, 2011 4:53 pm Post subject: Posted: Tue Nov 08, 2011 4:53 pm Post subject: |
 |
|
| casper wrote: |
read the following threads for a clarification
if u still need clarification, then u have my email id already, come in chat any days after 8.30 pm |
hi casper thankx once again i had read nvk thread but i will read one more time all of three n get back to u whenever have some doubt....
|
|
| Back to top |
|
 |
rk_a2003
Black Belt

Joined: 21 Jan 2010
Posts: 2734
|
Post: #2900  Posted: Tue Nov 08, 2011 8:28 pm Post subject: Posted: Tue Nov 08, 2011 8:28 pm Post subject: |
 |
|
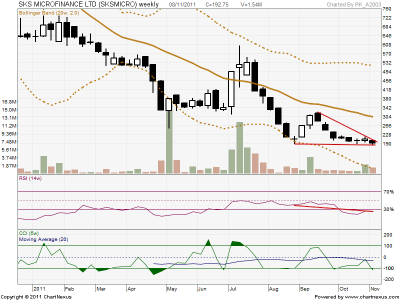
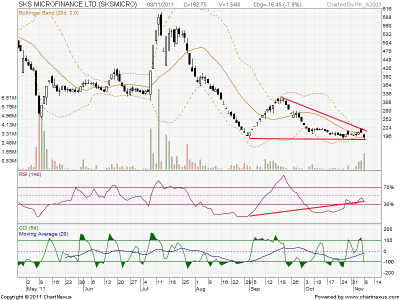
SKSMICRO EOD Chart.And Weekly Chart.
| Description: |
|
| Filesize: |
46.57 KB |
| Viewed: |
404 Time(s) |
|
| Description: |
|
| Filesize: |
55.28 KB |
| Viewed: |
424 Time(s) |
|
|
|
| Back to top |
|
 |
sumesh_sol
Brown Belt

Joined: 06 Jun 2010
Posts: 2344
|
Post: #2901  Posted: Wed Nov 09, 2011 9:59 am Post subject: SINTEX..60TF Posted: Wed Nov 09, 2011 9:59 am Post subject: SINTEX..60TF |
 |
|
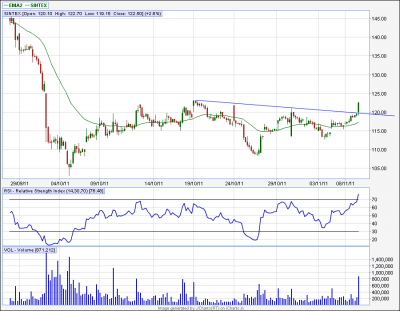
SINTEX..60TF
===========
H&S BO on 60tf..
Tgt can be 130/132
| Description: |
|
| Filesize: |
30.83 KB |
| Viewed: |
382 Time(s) |
|
|
|
| Back to top |
|
 |
sangi
White Belt

Joined: 19 Jan 2008
Posts: 69
|
Post: #2902  Posted: Wed Nov 09, 2011 12:03 pm Post subject: Posted: Wed Nov 09, 2011 12:03 pm Post subject: |
 |
|
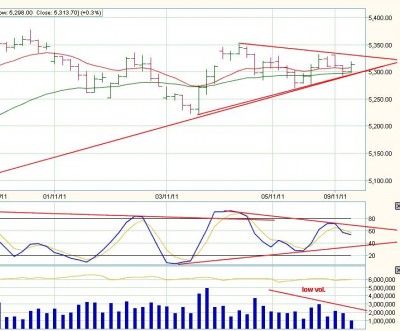
casperji/sumesh ji,
kindly confirm the sym. triangle and wht would be SL if UTL/LTL breaks for long/short?
Iam a newbee. pl. help to learn. Thanks in adv.
Sangi
| Description: |
|
| Filesize: |
71.51 KB |
| Viewed: |
392 Time(s) |
|
|
|
| Back to top |
|
 |
sumesh_sol
Brown Belt

Joined: 06 Jun 2010
Posts: 2344
|
Post: #2903  Posted: Wed Nov 09, 2011 12:35 pm Post subject: SAIL Posted: Wed Nov 09, 2011 12:35 pm Post subject: SAIL |
 |
|
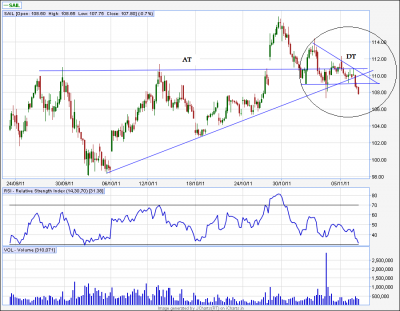
SAIL..60tf
========
SAIl took A BO from AT .. then, it seems it could not hold it and closed below BO level, and made a DT..
Now it has broken DT..
Now, as per me a SHORT can be initiated from this level for 103/104 level (cmp-108), with a SL of close above BD level (110).. Please take your call..
Regards,
Sumesh
| Description: |
|
| Filesize: |
57.52 KB |
| Viewed: |
408 Time(s) |
|
|
|
| Back to top |
|
 |
sumesh_sol
Brown Belt

Joined: 06 Jun 2010
Posts: 2344
|
Post: #2904  Posted: Wed Nov 09, 2011 12:37 pm Post subject: Posted: Wed Nov 09, 2011 12:37 pm Post subject: |
 |
|
| sangi wrote: | casperji/sumesh ji,
kindly confirm the sym. triangle and wht would be SL if UTL/LTL breaks for long/short?
Iam a newbee. pl. help to learn. Thanks in adv.
Sangi |
Hi,
Symm. Triangles are very notorious in taking out SLs , so better find some proper AT/DT and trade them..
Regards,
Sumesh
|
|
| Back to top |
|
 |
sangi
White Belt

Joined: 19 Jan 2008
Posts: 69
|
Post: #2905  Posted: Wed Nov 09, 2011 12:39 pm Post subject: Posted: Wed Nov 09, 2011 12:39 pm Post subject: |
 |
|
| sumesh_sol wrote: | | sangi wrote: | casperji/sumesh ji,
kindly confirm the sym. triangle and wht would be SL if UTL/LTL breaks for long/short?
Iam a newbee. pl. help to learn. Thanks in adv.
Sangi |
Hi,
Symm. Triangles are very notorious in taking out SLs , so better find some proper AT/DT and trade them..
Regards,
Sumesh |
Thanku sumesh ji
|
|
| Back to top |
|
 |
ronypan
White Belt

Joined: 07 Aug 2010
Posts: 197
|
Post: #2906  Posted: Wed Nov 09, 2011 1:13 pm Post subject: Posted: Wed Nov 09, 2011 1:13 pm Post subject: |
 |
|
@Casper, Sumesh
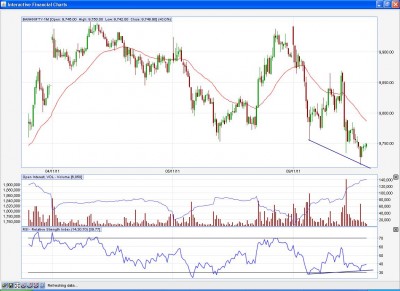
Can we consider +Divergence in Banknifty 5 Mins Chart?
| Description: |
|
| Filesize: |
133.57 KB |
| Viewed: |
411 Time(s) |
|
|
|
| Back to top |
|
 |
sumesh_sol
Brown Belt

Joined: 06 Jun 2010
Posts: 2344
|
Post: #2907  Posted: Wed Nov 09, 2011 2:04 pm Post subject: M&M-1M Posted: Wed Nov 09, 2011 2:04 pm Post subject: M&M-1M |
 |
|
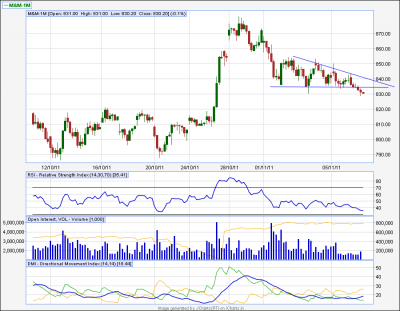
M&M-1M ..60tf
========
Looks like have broken DT..
LTP-830, Tgt can be 815/810 and SL could be a close on 60tf above BD level (somewhere 836).
| Description: |
|
| Filesize: |
38.62 KB |
| Viewed: |
394 Time(s) |
|
|
|
| Back to top |
|
 |
sumesh_sol
Brown Belt

Joined: 06 Jun 2010
Posts: 2344
|
Post: #2908  Posted: Wed Nov 09, 2011 2:16 pm Post subject: Posted: Wed Nov 09, 2011 2:16 pm Post subject: |
 |
|
| ronypan wrote: | @Casper, Sumesh
Can we consider +Divergence in Banknifty 5 Mins Chart? |
Hi Rony, For + divergence to be effective it should not have crossed 50/60 before making another low. Here , it has crossed it , so in my opinion the div. effect is nullified..
|
|
| Back to top |
|
 |
ronypan
White Belt

Joined: 07 Aug 2010
Posts: 197
|
Post: #2909  Posted: Wed Nov 09, 2011 2:33 pm Post subject: Posted: Wed Nov 09, 2011 2:33 pm Post subject: |
 |
|
| sumesh_sol wrote: | | ronypan wrote: | @Casper, Sumesh
Can we consider +Divergence in Banknifty 5 Mins Chart? |
Hi Rony, For + divergence to be effective it should not have crossed 50/60 before making another low. Here , it has crossed it , so in my opinion the div. effect is nullified.. |
Thanks sumesh for reply.. well whenever if u find any divergence in any chart, plz do post just to understand...
|
|
| Back to top |
|
 |
sumesh_sol
Brown Belt

Joined: 06 Jun 2010
Posts: 2344
|
Post: #2910  Posted: Wed Nov 09, 2011 3:11 pm Post subject: Re: M&M-1M Posted: Wed Nov 09, 2011 3:11 pm Post subject: Re: M&M-1M |
 |
|
| sumesh_sol wrote: | M&M-1M ..60tf
========
Looks like have broken DT..
LTP-830, Tgt can be 815/810 and SL could be a close on 60tf above BD level (somewhere 836). |
First Tgt 815 done.. However, I booked out earlier (at 820 itself)..
|
|
| Back to top |
|
 |
|

