| View previous topic :: View next topic |
| Author |
a layman's approach to break out and break down |
solanki
White Belt

Joined: 12 Feb 2007
Posts: 155
|
Post: #2941  Posted: Thu Nov 17, 2011 10:40 am Post subject: Re: nifty-1m60tf Posted: Thu Nov 17, 2011 10:40 am Post subject: Re: nifty-1m60tf |
 |
|
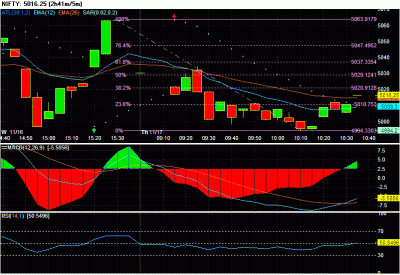
intraday nifty cash chart 5 mini TF
| Description: |
|
| Filesize: |
25.76 KB |
| Viewed: |
467 Time(s) |
|
|
|
| Back to top |
|
 |
|
|
 |
solanki
White Belt

Joined: 12 Feb 2007
Posts: 155
|
Post: #2942  Posted: Thu Nov 17, 2011 10:41 am Post subject: Re: nifty-1m60tf Posted: Thu Nov 17, 2011 10:41 am Post subject: Re: nifty-1m60tf |
 |
|
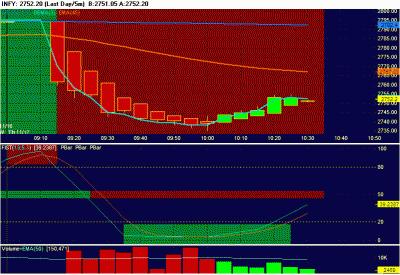
| solanki wrote: | | intraday nifty cash chart 5 mini TF |
| Description: |
|
| Filesize: |
23.56 KB |
| Viewed: |
450 Time(s) |
|
|
|
| Back to top |
|
 |
solanki
White Belt

Joined: 12 Feb 2007
Posts: 155
|
Post: #2943  Posted: Thu Nov 17, 2011 10:43 am Post subject: Re: nifty-1m60tf Posted: Thu Nov 17, 2011 10:43 am Post subject: Re: nifty-1m60tf |
 |
|
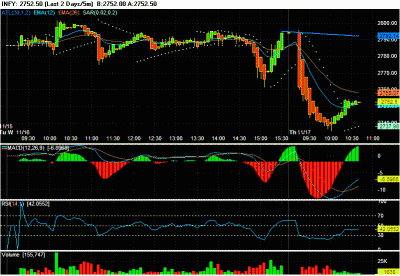
infy intraday 5 mini TF
| Description: |
|
| Filesize: |
27.67 KB |
| Viewed: |
489 Time(s) |
|
|
|
| Back to top |
|
 |
solanki
White Belt

Joined: 12 Feb 2007
Posts: 155
|
Post: #2944  Posted: Thu Nov 17, 2011 11:23 am Post subject: Re: nifty-1m60tf Posted: Thu Nov 17, 2011 11:23 am Post subject: Re: nifty-1m60tf |
 |
|
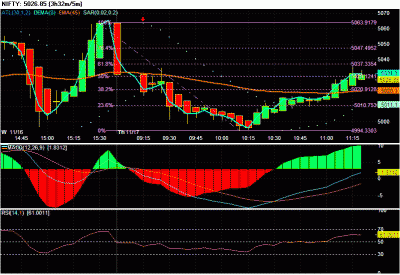
nifty cash charts at 11.22 am 5 mini time frame
| Description: |
|
| Filesize: |
26.92 KB |
| Viewed: |
454 Time(s) |
|
|
|
| Back to top |
|
 |
solanki
White Belt

Joined: 12 Feb 2007
Posts: 155
|
Post: #2945  Posted: Thu Nov 17, 2011 11:26 am Post subject: Re: nifty-1m60tf Posted: Thu Nov 17, 2011 11:26 am Post subject: Re: nifty-1m60tf |
 |
|
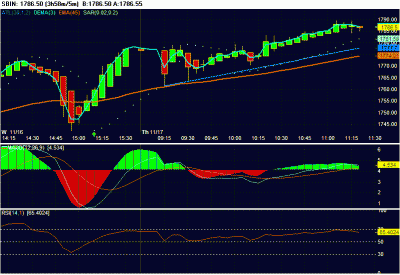
nse sbin cah chart @ 11.25 5 min time frame
| Description: |
|
| Filesize: |
24.86 KB |
| Viewed: |
477 Time(s) |
|
|
|
| Back to top |
|
 |
sumesh_sol
Brown Belt

Joined: 06 Jun 2010
Posts: 2344
|
Post: #2946  Posted: Fri Nov 18, 2011 2:04 pm Post subject: HINDUNILVR-1M Posted: Fri Nov 18, 2011 2:04 pm Post subject: HINDUNILVR-1M |
 |
|
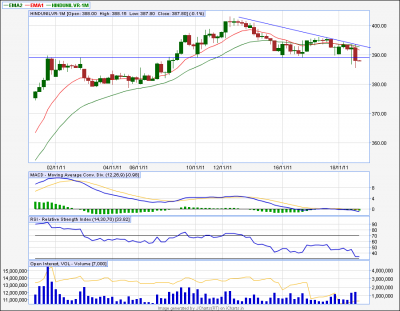
HINDUNILVR-1M..60TF
==============
Closed below Previous support... 12/26 crossover happened Also, MACD in -ve zone. should break now upto 380
| Description: |
|
| Filesize: |
38.04 KB |
| Viewed: |
419 Time(s) |
|
|
|
| Back to top |
|
 |
sangi
White Belt

Joined: 19 Jan 2008
Posts: 69
|
Post: #2947  Posted: Fri Nov 18, 2011 3:10 pm Post subject: Posted: Fri Nov 18, 2011 3:10 pm Post subject: |
 |
|
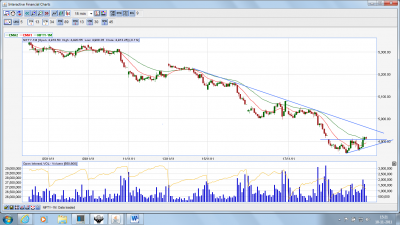
sumeshji, is there any AT breakout in 5tf niftyf? If so is it valid in a bearish trend? pl. reply.
Rds,
Sangi
|
|
| Back to top |
|
 |
sumesh_sol
Brown Belt

Joined: 06 Jun 2010
Posts: 2344
|
Post: #2948  Posted: Fri Nov 18, 2011 3:16 pm Post subject: Posted: Fri Nov 18, 2011 3:16 pm Post subject: |
 |
|
| sangi wrote: | sumeshji, is there any AT breakout in 5tf niftyf? If so is it valid in a bearish trend? pl. reply.
Rds,
Sangi |
I can;t see any, can u please post your chart.. ?
|
|
| Back to top |
|
 |
sangi
White Belt

Joined: 19 Jan 2008
Posts: 69
|
Post: #2949  Posted: Fri Nov 18, 2011 3:23 pm Post subject: Posted: Fri Nov 18, 2011 3:23 pm Post subject: |
 |
|
| sumesh_sol wrote: | | sangi wrote: | sumeshji, is there any AT breakout in 5tf niftyf? If so is it valid in a bearish trend? pl. reply.
Rds,
Sangi |
I can;t see any, can u please post your chart.. ? |
i hv attched 15tf chart.
| Description: |
|
| Filesize: |
146.88 KB |
| Viewed: |
444 Time(s) |
|
|
|
| Back to top |
|
 |
sangi
White Belt

Joined: 19 Jan 2008
Posts: 69
|
Post: #2950  Posted: Fri Nov 18, 2011 3:31 pm Post subject: Posted: Fri Nov 18, 2011 3:31 pm Post subject: |
 |
|
| sumesh_sol wrote: | | sangi wrote: | sumeshji, is there any AT breakout in 5tf niftyf? If so is it valid in a bearish trend? pl. reply.
Rds,
Sangi |
I can;t see any, can u please post your chart.. ? |
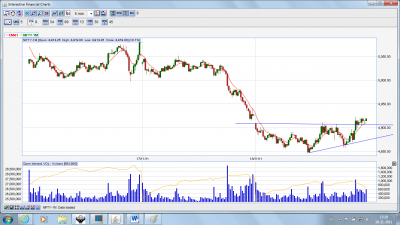
Here is the 5tf nf chart. i hv attched 15tf nf chart in my blow post. pl. hv a look at tht also. pl. correct me whenever im wrong.
rgds,
sangi
| Description: |
|
| Filesize: |
137.74 KB |
| Viewed: |
449 Time(s) |
|
|
|
| Back to top |
|
 |
sumesh_sol
Brown Belt

Joined: 06 Jun 2010
Posts: 2344
|
Post: #2951  Posted: Fri Nov 18, 2011 3:46 pm Post subject: Posted: Fri Nov 18, 2011 3:46 pm Post subject: |
 |
|
| sangi wrote: | | sumesh_sol wrote: | | sangi wrote: | sumeshji, is there any AT breakout in 5tf niftyf? If so is it valid in a bearish trend? pl. reply.
Rds,
Sangi |
I can;t see any, can u please post your chart.. ? |
Here is the 5tf nf chart. i hv attched 15tf nf chart in my blow post. pl. hv a look at tht also. pl. correct me whenever im wrong.
rgds,
sangi |
Sangi, The funda behind AT is that there are many attmepts at top to prevent price before price makes lows (though rising) and finally bears give in and bulls take it out with force.. Here as you can see there were only two valid attmenpt to break the top before lows were made.. So not exactly BO...
In any case, first top u indicated should not be part of Res. line as it was a "part" on earlier down trend..
|
|
| Back to top |
|
 |
sangi
White Belt

Joined: 19 Jan 2008
Posts: 69
|
Post: #2952  Posted: Fri Nov 18, 2011 4:00 pm Post subject: Posted: Fri Nov 18, 2011 4:00 pm Post subject: |
 |
|
thank u sumeshji, now clear 
|
|
| Back to top |
|
 |
Padkondu
White Belt

Joined: 23 Jan 2008
Posts: 120
|
Post: #2953  Posted: Fri Nov 18, 2011 4:04 pm Post subject: Spotting patterns Posted: Fri Nov 18, 2011 4:04 pm Post subject: Spotting patterns |
 |
|
| sumesh_sol wrote: | | sangi wrote: | | sumesh_sol wrote: | | sangi wrote: | sumeshji, is there any AT breakout in 5tf niftyf? If so is it valid in a bearish trend? pl. reply.
Rds,
Sangi |
I can;t see any, can u please post your chart.. ? |
Here is the 5tf nf chart. i hv attched 15tf nf chart in my blow post. pl. hv a look at tht also. pl. correct me whenever im wrong.
rgds,
sangi |
Sangi, The funda behind AT is that there are many attmepts at top to prevent price before price makes lows (though rising) and finally bears give in and bulls take it out with force.. Here as you can see there were only two valid attmenpt to break the top before lows were made.. So not exactly BO...
In any case, first top u indicated should not be part of Res. line as it was a "part" on earlier down trend.. |
Sanghi
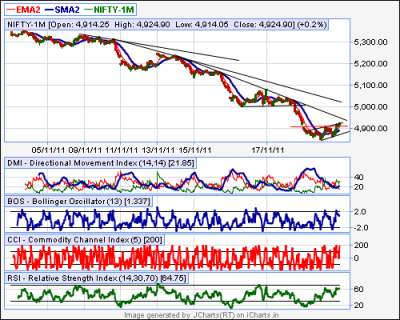
as sumesh ji said an AT requires atleast - 2-3 attempts at top. lines can be drawn form anywhere to anywhere. but line becomes more and more important with more and more contacts with price. so now is it not a channel? just hv a look at the chart i posted. the red line is the one you hv drawn
Regards
Padkondu
| Description: |
|
| Filesize: |
36.47 KB |
| Viewed: |
424 Time(s) |
|
|
|
| Back to top |
|
 |
rk_a2003
Black Belt

Joined: 21 Jan 2010
Posts: 2734
|
Post: #2954  Posted: Fri Nov 18, 2011 4:30 pm Post subject: Posted: Fri Nov 18, 2011 4:30 pm Post subject: |
 |
|
"The ascending triangle is a bullish formation that usually forms during an uptrend as a continuation pattern. There are instances when ascending triangles form as reversal patterns at the end of a downtrend, but they are typically continuation patterns."
Sumesh! The AT given in the chart is located in a relative down trend.Then can we consider it as a valid AT?!.Unless otherwise we were sure that it is a reversal pattern.
|
|
| Back to top |
|
 |
sumesh_sol
Brown Belt

Joined: 06 Jun 2010
Posts: 2344
|
Post: #2955  Posted: Fri Nov 18, 2011 8:35 pm Post subject: Posted: Fri Nov 18, 2011 8:35 pm Post subject: |
 |
|
| rk_a2003 wrote: | "The ascending triangle is a bullish formation that usually forms during an uptrend as a continuation pattern. There are instances when ascending triangles form as reversal patterns at the end of a downtrend, but they are typically continuation patterns."
Sumesh! The AT given in the chart is located in a relative down trend.Then can we consider it as a valid AT?!.Unless otherwise we were sure that it is a reversal pattern. |
AT in downtrend are always risky, so better to book profit early... However, this time around it was not a proper AT at bottom....
|
|
| Back to top |
|
 |
|

