| View previous topic :: View next topic |
| Author |
a layman's approach to break out and break down |
sangi
White Belt

Joined: 19 Jan 2008
Posts: 69
|
Post: #2956  Posted: Sun Nov 20, 2011 4:41 pm Post subject: hcltech-30m Posted: Sun Nov 20, 2011 4:41 pm Post subject: hcltech-30m |
 |
|
Sumeshji,
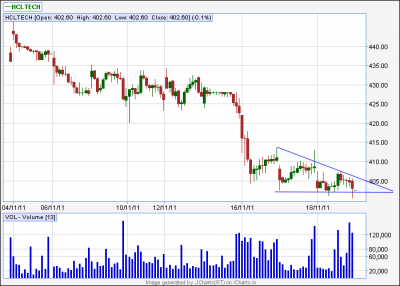
I hv attached hcltech-30m chart? Is this a proper DT? Pl. comment and correct.
Rgds,
Sangi
| Description: |
|
| Filesize: |
12.38 KB |
| Viewed: |
460 Time(s) |
|
|
|
| Back to top |
|
 |
|
|
 |
casper
Green Belt

Joined: 02 Oct 2010
Posts: 1315
|
Post: #2957  Posted: Sun Nov 20, 2011 5:12 pm Post subject: Re: hcltech-30m Posted: Sun Nov 20, 2011 5:12 pm Post subject: Re: hcltech-30m |
 |
|
| sangi wrote: | Sumeshji,
I hv attached hcltech-30m chart? Is this a proper DT? Pl. comment and correct.
Rgds,
Sangi |
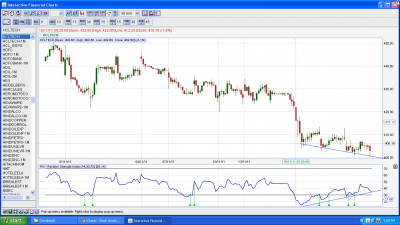
ur lower tl is not so good, it should be retested more often to show that a support (viz buying) is coming from that tl, besides u hv divergence not only in 30 min but also in 60 min too,
so over all i feel it will go up if it breaks the upper tl
BE CAREFUL FOR + DIV IN DT AND - DIV IN AT....... ALWAYS
| Description: |
|
| Filesize: |
95.35 KB |
| Viewed: |
472 Time(s) |
|
|
|
| Back to top |
|
 |
sumesh_sol
Brown Belt

Joined: 06 Jun 2010
Posts: 2344
|
Post: #2958  Posted: Sun Nov 20, 2011 8:45 pm Post subject: Re: hcltech-30m Posted: Sun Nov 20, 2011 8:45 pm Post subject: Re: hcltech-30m |
 |
|
| casper wrote: | | sangi wrote: | Sumeshji,
I hv attached hcltech-30m chart? Is this a proper DT? Pl. comment and correct.
Rgds,
Sangi |
ur lower tl is not so good, it should be retested more often to show that a support (viz buying) is coming from that tl, besides u hv divergence not only in 30 min but also in 60 min too,
so over all i feel it will go up if it breaks the upper tl
BE CAREFUL FOR + DIV IN DT AND - DIV IN AT....... ALWAYS |
Casper bhai very correct, one must always pay attention to RSI in proper perspective..
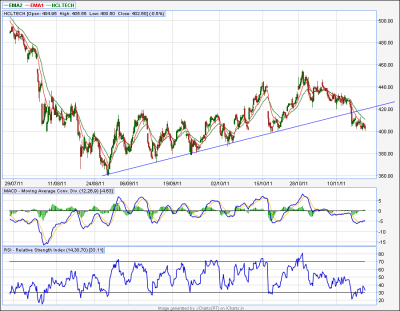
Sangi, if u see my attached chart (60tf), you can see hcltech is clearly in downtrend after breaking down TL, however, there will always be some retrace back in such BO/BD cases, so if you want to short then try on rejection of 26 or 34 ema on hourly with SL of high of candle ...
| Description: |
|
| Filesize: |
78.68 KB |
| Viewed: |
463 Time(s) |
|
|
|
| Back to top |
|
 |
sumesh_sol
Brown Belt

Joined: 06 Jun 2010
Posts: 2344
|
Post: #2959  Posted: Sun Nov 20, 2011 9:09 pm Post subject: BAJAJ-AUTO Posted: Sun Nov 20, 2011 9:09 pm Post subject: BAJAJ-AUTO |
 |
|
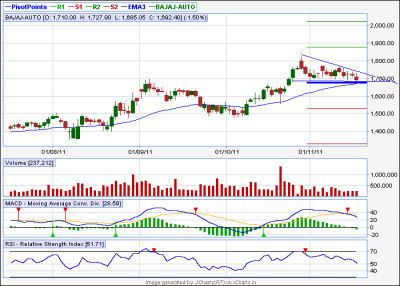
BAJAJ-AUTO..eod...
============
Appears to be taking support on monthly pivot, if breaks and closes below it , then downside could be 1600/1550 !
| Description: |
|
| Filesize: |
22.69 KB |
| Viewed: |
453 Time(s) |
|
|
|
| Back to top |
|
 |
nsinojia
Yellow Belt

Joined: 21 Dec 2009
Posts: 624
|
Post: #2960  Posted: Sun Nov 20, 2011 9:16 pm Post subject: Re: BAJAJ-AUTO Posted: Sun Nov 20, 2011 9:16 pm Post subject: Re: BAJAJ-AUTO |
 |
|
| sumesh_sol wrote: | BAJAJ-AUTO..eod...
============
Appears to be taking support on monthly pivot, if breaks and closes below it , then downside could be 1600/1550 ! |
 
|
|
| Back to top |
|
 |
sangi
White Belt

Joined: 19 Jan 2008
Posts: 69
|
Post: #2961  Posted: Sun Nov 20, 2011 10:03 pm Post subject: Re: hcltech-30m Posted: Sun Nov 20, 2011 10:03 pm Post subject: Re: hcltech-30m |
 |
|
| sumesh_sol wrote: | | casper wrote: | | sangi wrote: | Sumeshji,
I hv attached hcltech-30m chart? Is this a proper DT? Pl. comment and correct.
Rgds,
Sangi |
ur lower tl is not so good, it should be retested more often to show that a support (viz buying) is coming from that tl, besides u hv divergence not only in 30 min but also in 60 min too,
so over all i feel it will go up if it breaks the upper tl
BE CAREFUL FOR + DIV IN DT AND - DIV IN AT....... ALWAYS |
Casper bhai very correct, one must always pay attention to RSI in proper perspective..
Sangi, if u see my attached chart (60tf), you can see hcltech is clearly in downtrend after breaking down TL, however, there will always be some retrace back in such BO/BD cases, so if you want to short then try on rejection of 26 or 34 ema on hourly with SL of high of candle ... |
Casperji/sumeshji,
Thank u very much! you both are doing an excellent job by guiding the beginners like me. So kind of u 
regds,
Sangi
|
|
| Back to top |
|
 |
sangi
White Belt

Joined: 19 Jan 2008
Posts: 69
|
Post: #2962  Posted: Mon Nov 21, 2011 1:01 pm Post subject: Posted: Mon Nov 21, 2011 1:01 pm Post subject: |
 |
|
Sumeshji,
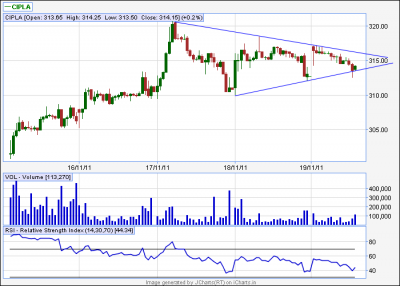
pl. comment on the chart of cipla-15m. Is is a valid ST?
| Description: |
|
| Filesize: |
14.82 KB |
| Viewed: |
457 Time(s) |
|
|
|
| Back to top |
|
 |
sumesh_sol
Brown Belt

Joined: 06 Jun 2010
Posts: 2344
|
Post: #2963  Posted: Wed Nov 23, 2011 12:39 pm Post subject: INDUSINDBK Posted: Wed Nov 23, 2011 12:39 pm Post subject: INDUSINDBK |
 |
|
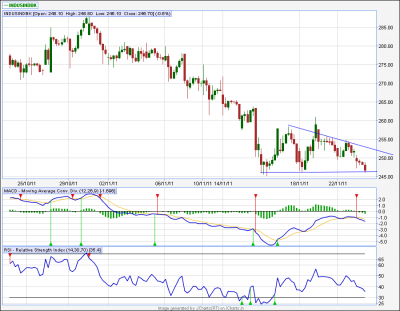
INDUSINDBK..60tf
===========
Identified by nitin sir using his method of 12/26 crossover..
I saw one DT pattern, so posting here for everyone's benefit..
If closes below 245 on hourly can give 10 rs fall..
| Description: |
|
| Filesize: |
35.17 KB |
| Viewed: |
489 Time(s) |
|
|
|
| Back to top |
|
 |
S.S.
White Belt

Joined: 09 Feb 2011
Posts: 241
|
Post: #2964  Posted: Fri Nov 25, 2011 12:22 am Post subject: Posted: Fri Nov 25, 2011 12:22 am Post subject: |
 |
|
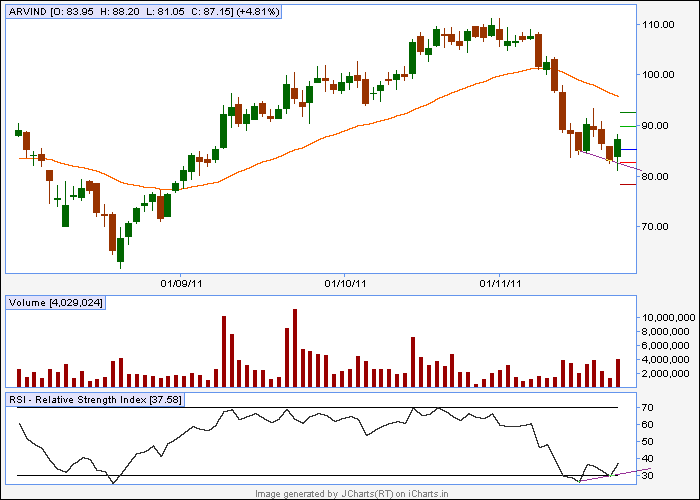
arvind EOD chart ....
| Description: |
|
| Filesize: |
8.33 KB |
| Viewed: |
2352 Time(s) |
|
|
|
| Back to top |
|
 |
rk_a2003
Black Belt

Joined: 21 Jan 2010
Posts: 2734
|
Post: #2965  Posted: Wed Nov 30, 2011 8:59 pm Post subject: Posted: Wed Nov 30, 2011 8:59 pm Post subject: |
 |
|
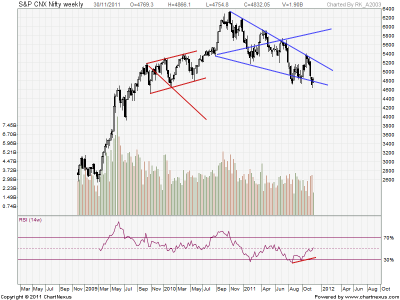
Nifty Weekly chart with RSI +div and a +WW formation.Also a double bottom formation observed at point 5. A historical
-WW which failed to reach the target was also marked.
(P.S : You are right vinay, reposting the Chart! Thanks)
| Description: |
|
| Filesize: |
38 KB |
| Viewed: |
460 Time(s) |
|
Last edited by rk_a2003 on Wed Nov 30, 2011 10:02 pm; edited 1 time in total |
|
| Back to top |
|
 |
vinay28
Black Belt

Joined: 24 Dec 2010
Posts: 11748
|
Post: #2966  Posted: Wed Nov 30, 2011 9:16 pm Post subject: Posted: Wed Nov 30, 2011 9:16 pm Post subject: |
 |
|
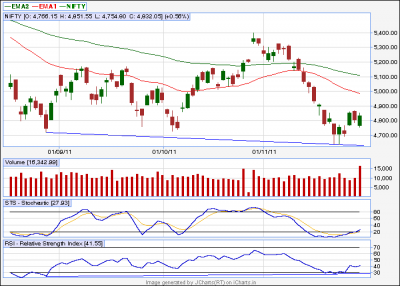
Correct me if I am wrong, RK. A +ve div should be shown by higher lows on rsi for lower lows on nifty. It does show here but you have drawn TL joining higher highs on rsi.
Attaching what I mean. Also, see STS.
Casper - your expert comments pl
| Description: |
|
| Filesize: |
11.88 KB |
| Viewed: |
443 Time(s) |
|
|
|
| Back to top |
|
 |
peace69
White Belt

Joined: 27 Aug 2009
Posts: 113
|
Post: #2967  Posted: Thu Dec 01, 2011 10:08 am Post subject: Posted: Thu Dec 01, 2011 10:08 am Post subject: |
 |
|
| rk_a2003 wrote: | Nifty Weekly chart with RSI +div and a +WW formation.Also a double bottom formation observed at point 5. A historical
-WW which failed to reach the target was also marked.
(P.S : You are right vinay, reposting the Chart! Thanks) |
hi rk. a hunch regarding to +ww. once rev from pt 5 & then retest LTL after failed attempt to cross UTL. is it still valid as per +ww? another caution regarding to TF. larger the TF, more risk involved on failure considering larger sl with larger TF. it's on w'ly & sl comes @ 4639 cash cmp is 4932. so it's 300 pts risk with nos of weeks/mths to reach tg. so it's for deep pocket & patience ones. although good one for general idea of possible dir in general. let me know if i'm mistaking somewhere. regards.
|
|
| Back to top |
|
 |
rk_a2003
Black Belt

Joined: 21 Jan 2010
Posts: 2734
|
Post: #2968  Posted: Thu Dec 01, 2011 11:38 am Post subject: Posted: Thu Dec 01, 2011 11:38 am Post subject: |
 |
|
You are absolutely right Peace
It's just for an understanding. Larger T.F is difficult to trade at least for small Traders. In my earlier posts I mentioned it and thought that no need to mention this time. However in my future posts will take care to mention .
Reg.WW I observed a common phenomenon especially in EOD and above TF that at point 5 after making D.B the wave is reaching the targets. That’s why i made it a point to look for that, that too... If with RSI Div it is better.
WW explanation may accommodate it as long as the peak of this wave did not violate UTL.But the bigger this wave the more ww nullified. In this case the wave is considerable .I thought due to strong RSI div may be we can consider this WW.
My main stress is on RSI div that's why I posted it here.WW is supplementary.
However the main purpose of this post is academic not to trade let us see how it goes.
| peace69 wrote: | | rk_a2003 wrote: | Nifty Weekly chart with RSI +div and a +WW formation.Also a double bottom formation observed at point 5. A historical
-WW which failed to reach the target was also marked.
(P.S : You are right vinay, reposting the Chart! Thanks) |
hi rk. a hunch regarding to +ww. once rev from pt 5 & then retest LTL after failed attempt to cross UTL. is it still valid as per +ww? another caution regarding to TF. larger the TF, more risk involved on failure considering larger sl with larger TF. it's on w'ly & sl comes @ 4639 cash cmp is 4932. so it's 300 pts risk with nos of weeks/mths to reach tg. so it's for deep pocket & patience ones. although good one for general idea of possible dir in general. let me know if i'm mistaking somewhere. regards. |
|
|
| Back to top |
|
 |
rk_a2003
Black Belt

Joined: 21 Jan 2010
Posts: 2734
|
Post: #2969  Posted: Sat Dec 10, 2011 6:57 pm Post subject: Posted: Sat Dec 10, 2011 6:57 pm Post subject: |
 |
|
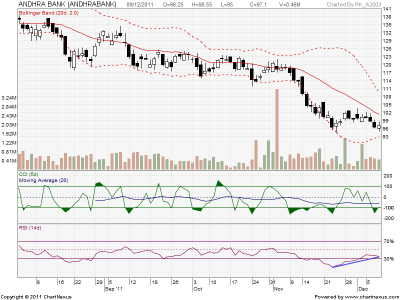
Andhra Bank EOD made a double bottom with +ve Div. Can we dare to go long?! .......Further Commentory/Analysis.... Welcome.
| Description: |
|
| Filesize: |
43.67 KB |
| Viewed: |
440 Time(s) |
|
|
|
| Back to top |
|
 |
veerappan
Expert

Joined: 19 Dec 2007
Posts: 3680
|
Post: #2970  Posted: Sat Dec 10, 2011 7:08 pm Post subject: Posted: Sat Dec 10, 2011 7:08 pm Post subject: |
 |
|
105.85 taken out u can go long with sl 100 carry posn with risk of 5.85 and target of 110-116-123 above 123 closes then 139 possible otherwise then 81 theory only....     f and o rates... f and o rates...
|
|
| Back to top |
|
 |
|

