|
|
| View previous topic :: View next topic |
| Author |
a layman's approach to break out and break down |
casper
Green Belt

Joined: 02 Oct 2010
Posts: 1315
|
Post: #2971  Posted: Sat Dec 10, 2011 7:28 pm Post subject: Posted: Sat Dec 10, 2011 7:28 pm Post subject: |
 |
|
| rk_a2003 wrote: | | Andhra Bank EOD made a double bottom with +ve Div. Can we dare to go long?! .......Further Commentory/Analysis.... Welcome. |
where vera sir starts i finish there....
for an intra to btst trade, buy at cmp, sl green candles low , with some cushion...low was 95. let the sl be 94.50 by closing
target 13 and 34 ema in eod viz 100-105.85
if down trend is so strong now, then it will be hard to break 13 ema, so better book some around 13 ema and rest put sl on cost, some more booking can be done at 34 ema (very unlikely to go beyond 34 ema in this kind of market, by the time u reach here, close most of the longs) a small qty can be kept for higher targets
alternatively u can book all at 34 ema and buy again, above 34 ema,as vera sir says, around 106 with sl of 100 (13 ema......... for me)

|
|
| Back to top |
|
 |
|
| |
Padkondu
White Belt

Joined: 23 Jan 2008
Posts: 120
|
| Post: #2972 Posted: Sat Dec 10, 2011 7:43 pm Post subject: divergence |
|
|
| rk_a2003 wrote: | | Andhra Bank EOD made a double bottom with +ve Div. Can we dare to go long?! .......Further Commentory/Analysis.... Welcome. |
Hi rk_a2003
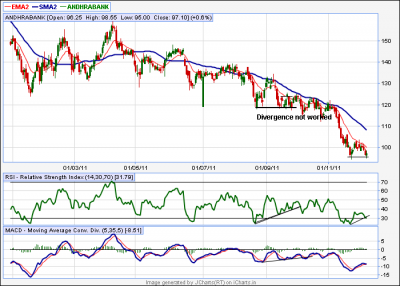
look at the chart below, previous positive divergence that is formed over 2 months during aug and sept 2011, did not work. the stock took support at monthly pivot S1. can we dare to go long now? not at all in view of the existing strong down trend in the stock. positive divergences are common place during down trend. i would not dare to go long. only hope is that there can be a small pull back taking support from here since the price gone too far from moving average ema34. i will wait for the stock to take out ema, monthly pivot at around 105.35, then taking support at ema/pivot for a move up. in other words i go with veera, but instead i wait for a strong close above ema/monthly pivot.
padkondu
| Description: |
| positive divergence in andhra bank eod |
|
| Filesize: |
32.92 KB |
| Viewed: |
537 Time(s) |
|
|
|
| Back to top |
|
|
casper
Green Belt
Joined: 02 Oct 2010
Posts: 1315
|
| Post: #2973 Posted: Sat Dec 10, 2011 7:57 pm Post subject: Re: divergence |
|
|
| Padkondu wrote: | | rk_a2003 wrote: | | Andhra Bank EOD made a double bottom with +ve Div. Can we dare to go long?! .......Further Commentory/Analysis.... Welcome. |
Hi rk_a2003
look at the chart below, previous positive divergence that is formed over 2 months during aug and sept 2011, did not work. can we dare to go long now? not at all in view of the existing strong down trend in the stock. positive divergences are common place during down trend. i would not dare to go long. only hope is that there can be a small pull back taking support from here since the price gone too far from moving average ema34.
padkondu |
hi anna, after a long time
u know we have developed a criteria for divergence,
according to that preset rule, the div u pointed out was destined to be failure
but this one, which rk pointed out, looks like a bit stronger than prev case, what is the diff in between these two?.
well , lets wait for a few days and if this time andhra bank rises, i will write the criteria once more coz if u try to find my prev post regarding the criteria , u may not find that easily
|
|
| Back to top |
|
|
Padkondu
White Belt
Joined: 23 Jan 2008
Posts: 120
|
| Post: #2974 Posted: Sat Dec 10, 2011 8:50 pm Post subject: Re: divergence |
|
|
| casper wrote: | | Padkondu wrote: | | rk_a2003 wrote: | | Andhra Bank EOD made a double bottom with +ve Div. Can we dare to go long?! .......Further Commentory/Analysis.... Welcome. |
Hi rk_a2003
look at the chart below, previous positive divergence that is formed over 2 months during aug and sept 2011, did not work. can we dare to go long now? not at all in view of the existing strong down trend in the stock. positive divergences are common place during down trend. i would not dare to go long. only hope is that there can be a small pull back taking support from here since the price gone too far from moving average ema34.
padkondu |
hi anna, after a long time
u know we have developed a criteria for divergence,
according to that preset rule, the div u pointed out was destined to be failure
but this one, which rk pointed out, looks like a bit stronger than prev case, what is the diff in between these two?.
well , lets wait for a few days and if this time andhra bank rises, i will write the criteria once more coz if u try to find my prev post regarding the criteria , u may not find that easily
|
Hi casper bhai.
I keep reading the posts by the gurus, like you, speculator sumesh and several others. but i could not find much time to participate in the forum actively. so it has really been a long time.
i would like to know much about the criteria you developed, but i can wait till you toss it on the forum.
padkondu
|
|
| Back to top |
|
|
chrome
Yellow Belt

Joined: 28 Dec 2009
Posts: 645
|
| Post: #2975 Posted: Sat Dec 10, 2011 9:13 pm Post subject: |
|
|
if all is going to sell heavily, who the hell will buy that quantity 
|
|
| Back to top |
|
|
chetan83
Brown Belt

Joined: 19 Feb 2010
Posts: 2037
|
| Post: #2976 Posted: Sat Dec 10, 2011 10:09 pm Post subject: Re: divergence |
|
|
| Padkondu wrote: | | casper wrote: | | Padkondu wrote: | | rk_a2003 wrote: | | Andhra Bank EOD made a double bottom with +ve Div. Can we dare to go long?! .......Further Commentory/Analysis.... Welcome. |
Hi rk_a2003
look at the chart below, previous positive divergence that is formed over 2 months during aug and sept 2011, did not work. can we dare to go long now? not at all in view of the existing strong down trend in the stock. positive divergences are common place during down trend. i would not dare to go long. only hope is that there can be a small pull back taking support from here since the price gone too far from moving average ema34.
padkondu |
hi anna, after a long time
u know we have developed a criteria for divergence,
according to that preset rule, the div u pointed out was destined to be failure
but this one, which rk pointed out, looks like a bit stronger than prev case, what is the diff in between these two?.
well , lets wait for a few days and if this time andhra bank rises, i will write the criteria once more coz if u try to find my prev post regarding the criteria , u may not find that easily
|
Hi casper bhai.
I keep reading the posts by the gurus, like you, speculator sumesh and several others. but i could not find much time to participate in the forum actively. so it has really been a long time.
i would like to know much about the criteria you developed, but i can wait till you toss it on the forum.
padkondu |
Hi All,
With my failure knowledge in TA  I cud only say that Casper is telling tht RSI mid point has not risen enough as in pevious case where it just shoot up to more than 50 and retraced and price went further down.....so...........lets see and let it give a positive closing again next day. I cud only say that Casper is telling tht RSI mid point has not risen enough as in pevious case where it just shoot up to more than 50 and retraced and price went further down.....so...........lets see and let it give a positive closing again next day.
regards,
Chetan.
|
|
| Back to top |
|
|
casper
Green Belt
Joined: 02 Oct 2010
Posts: 1315
|
| Post: #2977 Posted: Sat Dec 10, 2011 11:30 pm Post subject: |
|
|
| yes chetan bhaiya...... and number of days between two bottoms was also above our criteria
|
|
| Back to top |
|
|
chetan83
Brown Belt
Joined: 19 Feb 2010
Posts: 2037
|
|
| Back to top |
|
|
casper
Green Belt
Joined: 02 Oct 2010
Posts: 1315
|
| Post: #2979 Posted: Sun Dec 11, 2011 8:58 am Post subject: |
|
|
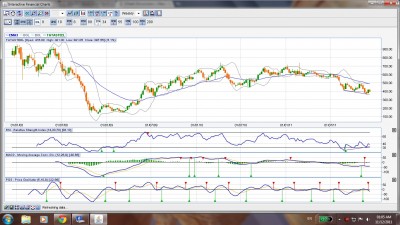
divergence with triple top or bottoms are logically more powerful than double bot or double top divergence, but i am not very sure of their success rate,
coz in spite of logically being very strong, some time they dont act up to the expectation........ why.... that i dont know yet, will definitely look into this segment in future
as of now, like any other div, here also u can buy with sl of present low by closing.... its weekly chart,hence weekly closing will be needed
target can be 13 and 34 ema in weekly chart
by the way , weekly chart is good for positional trades and i dont think that u r going to trade it positionally any way....so if it starts going up as we can expect it due to div, go in eod chart or 60 min chart and find out suitable bullish signals to pin point ur entry as well as exit
ps- as per the bollinger band , we can expect 500 and 650 in tatasteel in coming days.....i dont follow this method,coz it needs a bigger sl, its vishy anna's method actually, but i know how he does it
|
|
| Back to top |
|
|
chandrujimrc
Brown Belt
Joined: 21 Apr 2009
Posts: 1683
|
| Post: #2980 Posted: Sun Dec 11, 2011 3:23 pm Post subject: |
|
|
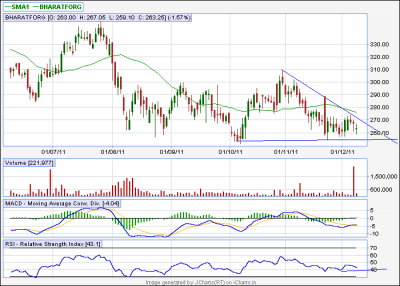
Dear Casper,
I need your view about Bharatforg -EOD,because there was a sudden spurt in volume on 8/12/2011.
chandru.
| Description: |
|
| Filesize: |
13.88 KB |
| Viewed: |
546 Time(s) |
|
|
|
| Back to top |
|
|
casper
Green Belt
Joined: 02 Oct 2010
Posts: 1315
|
| Post: #2981 Posted: Sun Dec 11, 2011 11:11 pm Post subject: |
|
|
hi chandru
i am not sure about the reason of sudden surge in volume, but when i see it in real time, i find it was gradually going down, then a + div came in 10 to 30 min tfs and it went up like hell
volume was aprox 20 lakh shares whereas a normal 30 min candle has an average vol of 5-10k in bharat forge
it could be due to some news release or some thing like that, since i dont trade stocks any more so i dont know what actually it was
but whatever the cause of the surge in volume may be, the good news is, rsi showed us a div and if we were trading it, we would have got the signal to go long here, this div is seen from various smaller tfs but i prefer the 10 min chart which im attaching, bcoz here apart from a div, we will get a "double bottom break out" or "channel break out" scenario too, and since it is a bo so i think this version best explains the volume part too
( charts tells all, that too, in well advance, this is the single most imp reason that i dont follow business/economical news)
| Description: |
|
| Filesize: |
76.53 KB |
| Viewed: |
553 Time(s) |
|
|
|
| Back to top |
|
|
chandrujimrc
Brown Belt
Joined: 21 Apr 2009
Posts: 1683
|
| Post: #2982 Posted: Mon Dec 12, 2011 9:07 am Post subject: |
|
|
Dear Casper,
Thank you sir.
chandru.
|
|
| Back to top |
|
|
rk_a2003
Black Belt

Joined: 21 Jan 2010
Posts: 2734
|
| Post: #2983 Posted: Tue Dec 13, 2011 6:06 am Post subject: |
|
|
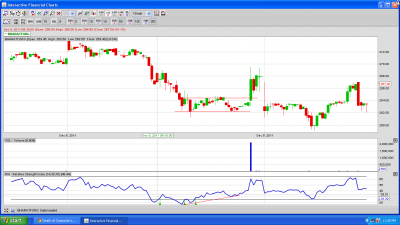
Casper
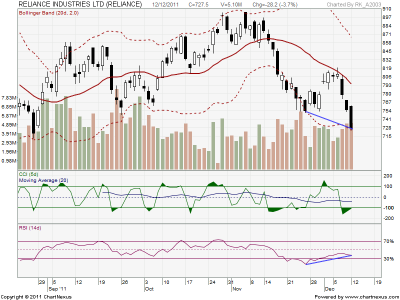
I am able to see RSI + Div in number of stocks including Nifty. Some Div's are really strong some are weak. Is it an indication for a possible bounce in the near term?! How to read or interpret this in the given context?.
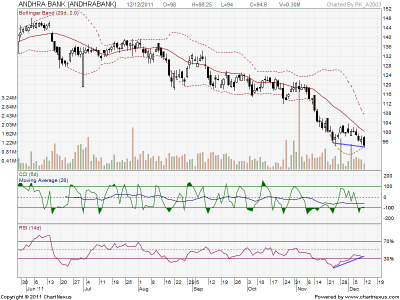
Posting Reliance and also latest Andhra bank Div. Now Andhra bank Div appears to be further strong; Price making new low and RSI making high. Even if today A.B goes down a little further RSI div might be intact making the case stronger. The case may be the same for Reliance too. How to trade these scenarios? Where to take entry? How to time?
I am clearly aware that when the sentiments are at the rock bottom and Markets are in tanking mood no Fundamentals/Technicals may work. Still I wanted to know how to deal with them and trade them with a specified well defined risk.
Please reply at your convenience. I am in no hurry to trade them.  ( Though Reliance formed a +WW a RSI div in place, even it may qualify for my Fusion criteria today...Too mouth watering ) ( Though Reliance formed a +WW a RSI div in place, even it may qualify for my Fusion criteria today...Too mouth watering )
| Description: |
|
| Filesize: |
48.05 KB |
| Viewed: |
522 Time(s) |
|
| Description: |
|
| Filesize: |
49.54 KB |
| Viewed: |
513 Time(s) |
|
|
|
| Back to top |
|
|
casper
Green Belt
Joined: 02 Oct 2010
Posts: 1315
|
| Post: #2984 Posted: Tue Dec 13, 2011 9:23 am Post subject: |
|
|
we need to wait for a green close to confirm the div, thats the only time, when, we can again buy AB as well as RIL
some knee jerk move may come, now i am totally out of eq market and dont hv real time charts too, so cant say what is cooking in real time, but if u hv RT chart, wait for 30-60 min div, followed by a green candle to initiate buy, a green in eod will be better but will take longer time to come than the 30-60 tf buy
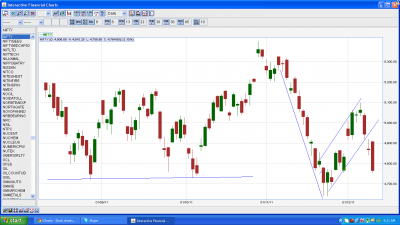
yday night i was checking nifty chart casually,on a friends req, it looks like nifty in eod had a bearish flag and it broken down, now target cud be a blood bath but i feel, some where in real time, it will give us some div and will bounce back again
so if any valid div comes we can always take a buy, with proper sl
but if no div comes then it will be a clear blood bath
| Description: |
|
| Filesize: |
81.42 KB |
| Viewed: |
503 Time(s) |
|
|
|
| Back to top |
|
|
rk_a2003
Black Belt
Joined: 21 Jan 2010
Posts: 2734
|
| Post: #2985 Posted: Tue Dec 13, 2011 9:33 am Post subject: |
|
|
Blood Bath ......Ha...Haa...Haaa. Only Traders have the Privilege to laugh at it.Is n't it?!
Thak you so much Casper.
|
|
| Back to top |
|
|
|
|
You cannot post new topics in this forum
You cannot reply to topics in this forum
You cannot edit your posts in this forum
You cannot delete your posts in this forum
You cannot vote in polls in this forum
You can attach files in this forum
You can download files in this forum
|
Powered by phpBB © 2001, 2005 phpBB Group
|
|
|