| View previous topic :: View next topic |
| Author |
a layman's approach to break out and break down |
as4manju
White Belt

Joined: 22 Mar 2007
Posts: 390
|
Post: #2986  Posted: Fri Dec 16, 2011 10:11 am Post subject: Posted: Fri Dec 16, 2011 10:11 am Post subject: |
 |
|
Nifty fut View
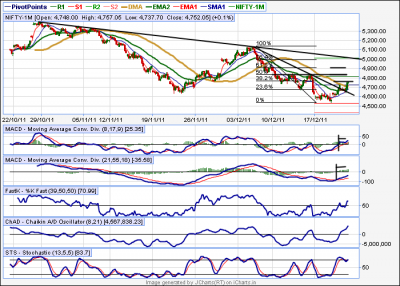
Nifty consistent lower top lower bottom formation.. from the low of 4670 (yesterday) we might move upto 4900 may be thats the best i can give for this pull back.. then start the down move n retest the lows of 4630 which is just a number but i guess below 4580 a HNS pattern will be completed and tgt for short term can be a down leg of 400-600 points that would take nifty close to 4200-4000.. its just my veiw and till the levels are not broken on down side the pattern is not complete i m just guessing in advance though...
Regards
Manju
| Description: |
|
| Filesize: |
106.51 KB |
| Viewed: |
626 Time(s) |
|
|
|
| Back to top |
|
 |
|
|
|
jjm
White Belt
Joined: 17 Mar 2010
Posts: 411
|
| Post: #2987 Posted: Thu Dec 22, 2011 5:19 pm Post subject: |
|
|
Casperda,
Hello!!
Trust, you are very much active in your venture
Regards,
JJM
| Description: |
|
| Filesize: |
14.87 KB |
| Viewed: |
635 Time(s) |
|
|
|
| Back to top |
|
|
maddyprincess
White Belt
Joined: 15 Nov 2011
Posts: 160
|
|
| Back to top |
|
|
vinay28
Black Belt

Joined: 24 Dec 2010
Posts: 11748
|
| Post: #2989 Posted: Thu Dec 22, 2011 7:37 pm Post subject: |
|
|
| maddyprincess, AT is formed at the top of an uptrend. Is it still valid?
|
|
| Back to top |
|
|
maddyprincess
White Belt
Joined: 15 Nov 2011
Posts: 160
|
| Post: #2990 Posted: Thu Dec 22, 2011 9:07 pm Post subject: |
|
|
| vinay28 wrote: | | maddyprincess, AT is formed at the top of an uptrend. Is it still valid? |
hi vinay28
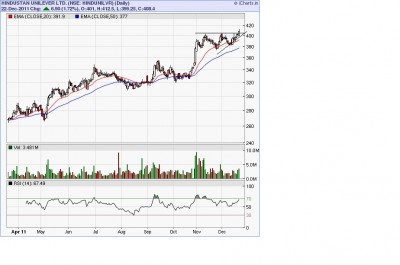
The ascending triangle is a bullish formation that usually forms during an uptrend as a continuation pattern. There are instances when ascending triangles form as reversal patterns at the end of a downtrend, but they are typically continuation patterns. Regardless of where they form, ascending triangles are bullish patterns that indicate accumulation.
Let's see !!!!!!!!!
|
|
| Back to top |
|
|
casper
Green Belt

Joined: 02 Oct 2010
Posts: 1315
|
| Post: #2991 Posted: Thu Dec 22, 2011 9:27 pm Post subject: |
|
|
| maddyprincess wrote: | | vinay28 wrote: | | maddyprincess, AT is formed at the top of an uptrend. Is it still valid? |
hi vinay28
The ascending triangle is a bullish formation that usually forms during an uptrend as a continuation pattern. There are instances when ascending triangles form as reversal patterns at the end of a downtrend, but they are typically continuation patterns. Regardless of where they form, ascending triangles are bullish patterns that indicate accumulation.
Let's see !!!!!!!!! |
nice explanation maddyprinces and nice pattern too, seen in weekly also , in eod it had divergence but did not fall and its going up, its a particularly bullish sign.......... a humble target is 430.....lets see what hppns here
|
|
| Back to top |
|
|
casper
Green Belt
Joined: 02 Oct 2010
Posts: 1315
|
|
| Back to top |
|
|
vinay28
Black Belt
Joined: 24 Dec 2010
Posts: 11748
|
| Post: #2993 Posted: Thu Dec 22, 2011 9:42 pm Post subject: |
|
|
thank you maddyprincess and casper. good learning. It is just that I read somewhere that ATs at the top of an uptrend do breakdown sometimes. Also, I felt that HUL, being a defensive stock, may go down if nifty goes up. I do accept that it has also moved with nifty sometimes in recent months.
Last edited by vinay28 on Thu Dec 22, 2011 9:53 pm; edited 1 time in total |
|
| Back to top |
|
|
casper
Green Belt
Joined: 02 Oct 2010
Posts: 1315
|
| Post: #2994 Posted: Thu Dec 22, 2011 9:43 pm Post subject: |
|
|
| as4manju wrote: | Nifty fut View
Nifty consistent lower top lower bottom formation.. from the low of 4670 (yesterday) we might move upto 4900 may be thats the best i can give for this pull back.. then start the down move n retest the lows of 4630 which is just a number but i guess below 4580 a HNS pattern will be completed and tgt for short term can be a down leg of 400-600 points that would take nifty close to 4200-4000.. its just my veiw and till the levels are not broken on down side the pattern is not complete i m just guessing in advance though...
Regards
Manju |
welcome back manju
both of us are too busy, but may i request u to keep posting some of ur calls? at least once in week? the old timers may agree with me that no body can give wonderful positional calls like u .............. at least i hv not seen any

|
|
| Back to top |
|
|
Padkondu
White Belt
Joined: 23 Jan 2008
Posts: 120
|
| Post: #2995 Posted: Thu Dec 22, 2011 9:58 pm Post subject: |
|
|
| as4manju wrote: | Nifty fut View
Nifty consistent lower top lower bottom formation.. from the low of 4670 (yesterday) we might move upto 4900 may be thats the best i can give for this pull back.. then start the down move n retest the lows of 4630 which is just a number but i guess below 4580 a HNS pattern will be completed and tgt for short term can be a down leg of 400-600 points that would take nifty close to 4200-4000.. its just my veiw and till the levels are not broken on down side the pattern is not complete i m just guessing in advance though...
Regards
Manju |
Manju Sir,
is the HNS means the head and shoulder pattern? if so, my understanding is that HNS is a bearish reversal pattern that forms at the top of an up trend and doesnot match the current down trend an inverted head and shoulder is the bearish reversal pattern that may form at the bottom of the down trend. is that right?
regards
padkondu
|
|
| Back to top |
|
|
rk_a2003
Black Belt
Joined: 21 Jan 2010
Posts: 2734
|
| Post: #2996 Posted: Thu Dec 22, 2011 10:14 pm Post subject: |
|
|
| as4manju wrote: | Nifty fut View
Nifty consistent lower top lower bottom formation.. from the low of 4670 (yesterday) we might move upto 4900 may be thats the best i can give for this pull back.. then start the down move n retest the lows of 4630 which is just a number but i guess below 4580 a HNS pattern will be completed and tgt for short term can be a down leg of 400-600 points that would take nifty close to 4200-4000.. its just my veiw and till the levels are not broken on down side the pattern is not complete i m just guessing in advance though...
Regards
Manju |
May I add some fundamental supporting view! The recently passed Food Security Bill needs approx. 200000 crores. Oil subsidy surmounted up to 80000 crores. Our budget is already reeling with deficit. Where from this money has to come?. Just from thin air. Govt. printing presses will work vigorously to meet these huge expenses.
Then Rupee is not an US $. It depreciates further. Inflation will shoot up. GDP flatters. Yesterday, when Indexes surge up more than 3 % FII’s and DII’s both remain net sellers…..surprising…When GDP mess up and Rupee depreciates what The FII’s are going to do.... Any body’s guess. This possible technical view could be the manifestation of this possible fundamental scenario. Only future can validate its relevance.
|
|
| Back to top |
|
|
Padkondu
White Belt
Joined: 23 Jan 2008
Posts: 120
|
| Post: #2997 Posted: Thu Dec 22, 2011 10:29 pm Post subject: Nifty view |
|
|
Hi
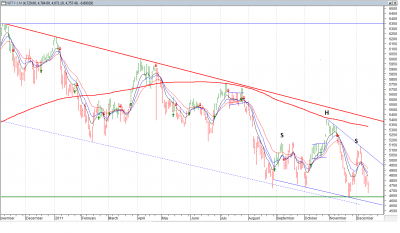
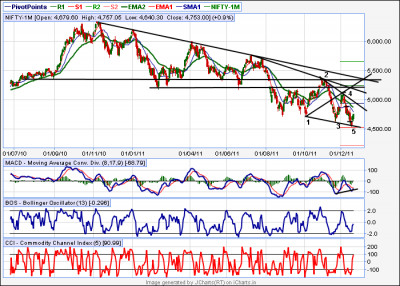
the eod chart of nifty has formed a wolf wave pattern and the 5th leg in the wolf wave formation is complete. a bullish reversal is on cards. the reversal is doubly confirmed by the bos and cci combination and divergence of macd. before it could meet the target there are several hiccups in the name of 13ema, 34ema, monthly pivot, and a strong resistance at around 5350 and beyond 5404... we can have a new up trend breaching the down trend line for over sevral months.
on down side, breach of 4522 could pull the market further to 4200 and then 3900........
the third option is the market may go range bound between 4500 and 5200.
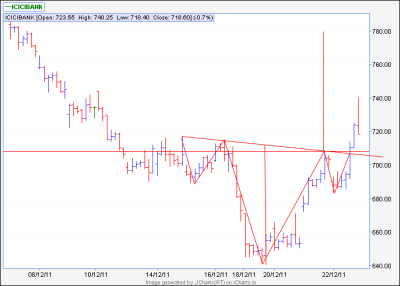
there is another 60min chart of nifty which indicates a trend change. the currenti immediate trend is up in 60 min. go to 15 min chart and buy using any entry strategy such as breakout of previous swing highs or CCI-5 etc and ofcourse with a stop loss.
it is for the market to decide what it will do. and it is for us to decide whether to follow the tiger to find a rabbit or fight the tiger and perish.
i love to see the feed back from the experts and know how experts view this and analyse the markets.
regards
padkondu
| Description: |
|
| Filesize: |
43.87 KB |
| Viewed: |
644 Time(s) |
|
| Description: |
|
| Filesize: |
52.6 KB |
| Viewed: |
625 Time(s) |
|
|
|
| Back to top |
|
|
S.S.
White Belt
Joined: 09 Feb 2011
Posts: 241
|
| Post: #2998 Posted: Fri Dec 23, 2011 12:37 am Post subject: |
|
|
| as4manju wrote: | Nifty fut View
Nifty consistent lower top lower bottom formation.. from the low of 4670 (yesterday) we might move upto 4900 may be thats the best i can give for this pull back.. then start the down move n retest the lows of 4630 which is just a number but i guess below 4580 a HNS pattern will be completed and tgt for short term can be a down leg of 400-600 points that would take nifty close to 4200-4000.. its just my veiw and till the levels are not broken on down side the pattern is not complete i m just guessing in advance though...
Regards
Manju |
nice to see u manju ...after very long break.... now hopefully..... i can get ur simple but very clear n effective veiw on market.....
|
|
| Back to top |
|
|
josabr
White Belt
Joined: 22 Jul 2009
Posts: 10
|
| Post: #2999 Posted: Fri Dec 23, 2011 12:39 am Post subject: Re: Nifty view |
|
|
| Padkondu wrote: | Hi
the eod chart of nifty has formed a wolf wave pattern and the 5th leg in the wolf wave formation is complete. a bullish reversal is on cards. the reversal is doubly confirmed by the bos and cci combination and divergence of macd. before it could meet the target there are several hiccups in the name of 13ema, 34ema, monthly pivot, and a strong resistance at around 5350 and beyond 5404... we can have a new up trend breaching the down trend line for over sevral months....................
............
regards
padkondu |
Hi Padkondu
Impressive analysis...a +ww was identified earlier a day or two ago on another thead (Running with wolves...i think); so your analysis reinforces that. Just curious if you have an eta for 5300-5400 levels. How high do you think the Nifty will go by this Dec end??
Thanks
Joe
|
|
| Back to top |
|
|
Padkondu
White Belt
Joined: 23 Jan 2008
Posts: 120
|
| Post: #3000 Posted: Fri Dec 23, 2011 5:06 am Post subject: Re: Nifty view |
|
|
| josabr wrote: | | Padkondu wrote: | Hi
the eod chart of nifty has formed a wolf wave pattern and the 5th leg in the wolf wave formation is complete. a bullish reversal is on cards. the reversal is doubly confirmed by the bos and cci combination and divergence of macd. before it could meet the target there are several hiccups in the name of 13ema, 34ema, monthly pivot, and a strong resistance at around 5350 and beyond 5404... we can have a new up trend breaching the down trend line for over sevral months....................
............
regards
padkondu |
Hi Padkondu
Impressive analysis...a +ww was identified earlier a day or two ago on another thead (Running with wolves...i think); so your analysis reinforces that. Just curious if you have an eta for 5300-5400 levels. How high do you think the Nifty will go by this Dec end??
Thanks
Joe |
Hi Josabr
I do not have any forecast on where nifty will go by the end of december. I just have a plan of action. If A happens do this, If B happens do this and if C happens do this. that is all.
I forgot to mention in the post that this is the view for a swing trader and i will try to go long keeping my stops. there are several hurdles to move past 5402, the fundamental and economic situation, apart from the technical view. this is least probable scenario. the other two situations - going down after this pull back or going sideways from here on are likely. however i keep my mind open to any situation.
further this post should have appeared in the the other thread, "running with the wolves". i posted here by mistake... becoz this is not the relavant thread.
regards
Padkondu
|
|
| Back to top |
|
|
|