|
|
| View previous topic :: View next topic |
| Author |
a layman's approach to break out and break down |
ragarwal
Yellow Belt

Joined: 16 Nov 2008
Posts: 582
|
Post: #31  Posted: Mon Oct 25, 2010 10:05 pm Post subject: Posted: Mon Oct 25, 2010 10:05 pm Post subject: |
 |
|
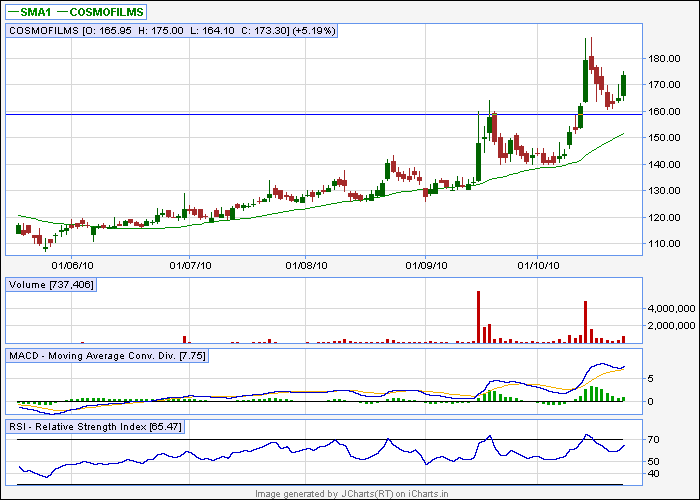
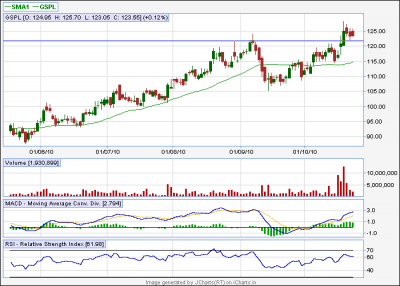
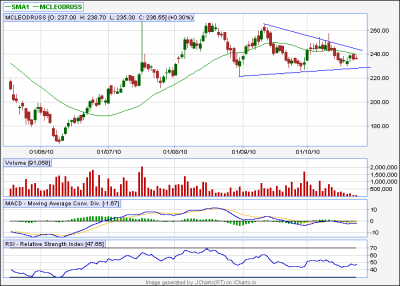
| hi,casper wat can u make of cosmo films,gspl and mcleod now.
|
|
| Back to top |
|
 |
|
| |
casper
Green Belt

Joined: 02 Oct 2010
Posts: 1315
|
| Post: #32 Posted: Mon Oct 25, 2010 11:02 pm Post subject: |
|
|
cosmo film= a big green candle may implies the end of consolidation, there is also a slight increase in vol,
mcleodruss= i told u that it will take time, and its taking its time, situation has not changed yet,neither positive nor negative change
gspl= consolidating, but still or bo or the trend line is intact
so the idea is, all three chart patterns are intact as of now, so i dont see any prb now, plz check the charts
| Description: |
|
| Filesize: |
11.21 KB |
| Viewed: |
3742 Time(s) |
|
| Description: |
|
| Filesize: |
12.06 KB |
| Viewed: |
607 Time(s) |
|
| Description: |
|
| Filesize: |
12.35 KB |
| Viewed: |
642 Time(s) |
|
|
|
| Back to top |
|
|
ragarwal
Yellow Belt
Joined: 16 Nov 2008
Posts: 582
|
| Post: #33 Posted: Mon Oct 25, 2010 11:07 pm Post subject: |
|
|
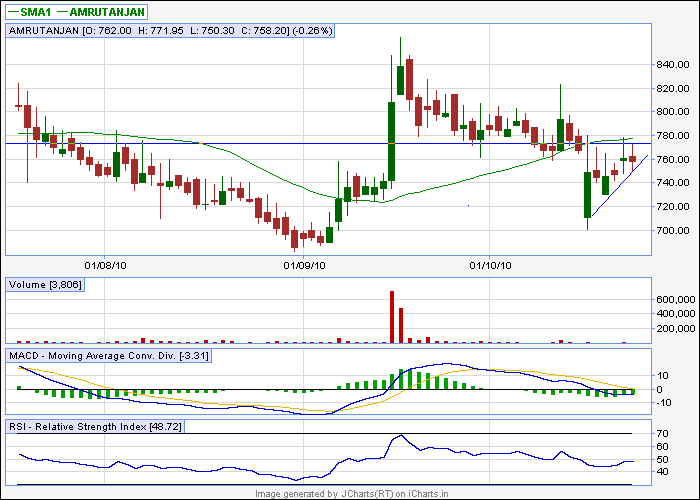
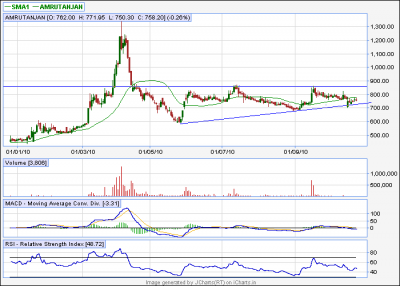
thanks a lot,can we see a triangle developing on d charts of amrutanjan,and that too a big 1,mayb 600 pts,please comment.
thanks and regards 
|
|
| Back to top |
|
|
casper
Green Belt
Joined: 02 Oct 2010
Posts: 1315
|
| Post: #34 Posted: Mon Oct 25, 2010 11:22 pm Post subject: |
|
|
a small bo in 1 or 2 days target around 50-65 rupees, it should happen in present level,
then another bo may happen in future around 850 level, here target will be for 300 rupees
(but i could not find any target of 600 or so, if u find it, then plz post the chart)
| Description: |
|
| Filesize: |
10.76 KB |
| Viewed: |
3698 Time(s) |
|
| Description: |
|
| Filesize: |
12.44 KB |
| Viewed: |
596 Time(s) |
|
|
|
| Back to top |
|
|
ragarwal
Yellow Belt
Joined: 16 Nov 2008
Posts: 582
|
| Post: #35 Posted: Mon Oct 25, 2010 11:31 pm Post subject: |
|
|
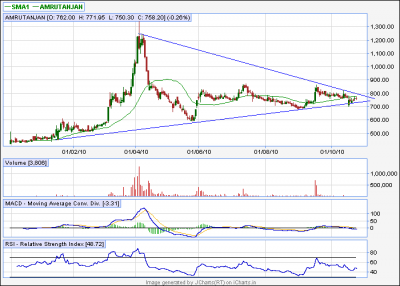
dear carper,the triangle that im referring 2 involves a larger time frame which is 10 mths old when amrutanjan was around 1200,i see a pattern developing similiar 2 abg ship yard
regards
|
|
| Back to top |
|
|
casper
Green Belt
Joined: 02 Oct 2010
Posts: 1315
|
| Post: #36 Posted: Mon Oct 25, 2010 11:46 pm Post subject: |
|
|
u mean this one? ya its may happen, but only two prbs are there
1. the upper trend line has got only 2 tops, in order to be confirmed, another top, viz a total of 3 point tops will be preferred
2. its a huge and time consuming pattern, so it will take time to reach the target also,
(say, the pattern has taken 10 months to form, now after bo, it will take atleast 1-2 months to reach the target)
i dont say it wont happen, its very much viable, but these 2 points are to be taken care of
| Description: |
|
| Filesize: |
13.31 KB |
| Viewed: |
629 Time(s) |
|
|
|
| Back to top |
|
|
ragarwal
Yellow Belt
Joined: 16 Nov 2008
Posts: 582
|
| Post: #37 Posted: Tue Oct 26, 2010 12:18 am Post subject: |
|
|
| yup ur ryt`,i meant this triangle only,lets c how it shapes out.
|
|
| Back to top |
|
|
casper
Green Belt
Joined: 02 Oct 2010
Posts: 1315
|
| Post: #38 Posted: Tue Oct 26, 2010 6:49 pm Post subject: |
|
|
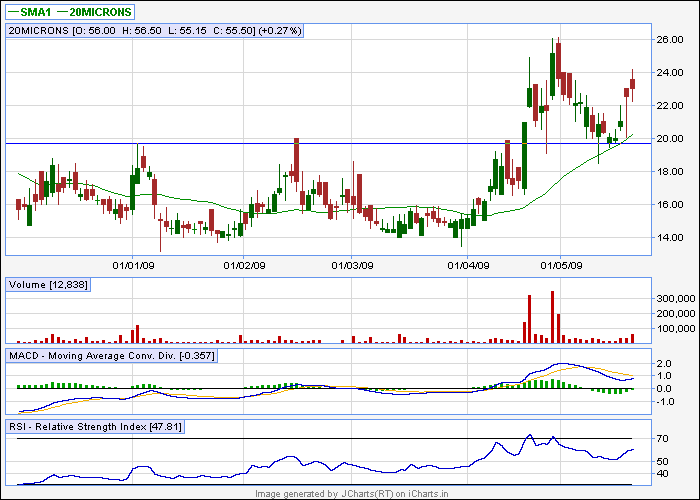
Double Bottom (Reversal)
The double bottom is a major reversal pattern that forms after an extended downtrend. As its name implies, the pattern is made up of two consecutive troughs that are roughly equal, with a moderate peak in-between.
Although there can be variations, the classic double bottom usually marks an intermediate or long-term change in trend. Many potential double bottoms can form along the way down, but until key resistance is broken, a reversal cannot be confirmed
IMPORTANT ASPECTS
1. Prior Trend: With any reversal pattern, there must be an existing trend to reverse. In the case of the double bottom, a significant downtrend of several months should be in place.
2. First Trough: The first trough should mark the lowest point of the current trend. As such, the first trough is fairly normal in appearance and the downtrend remains firmly in place.
3. Peak: After the first trough, an advance takes place that typically ranges from 10 to 20%. Volume on the advance from the first trough is usually inconsequential, but an increase could signal early accumulation. The high of the peak is sometimes rounded or drawn out a bit from the hesitation to go back down. This hesitation indicates that demand is increasing, but still not strong enough for a breakout.
4. Second Trough: The decline off the reaction high usually occurs with low volume and meets support from the previous low. Support from the previous low should be expected. Even after establishing support, only the possibility of a double bottom exists, it still needs to be confirmed. The time period between troughs can vary from a few weeks to many months, with the norm being 1-3 months. While exact troughs are preferable, there is some room to maneuver and usually a trough within 3% of the previous is considered valid.
5. Advance from Trough: Volume is more important for the double bottom than the double top. There should clear evidence that volume and buying pressure are accelerating during the advance off of the second trough. An accelerated ascent, perhaps marked with a gap or two, also indicates a potential change in sentiment.
6. Resistance Break: Even after trading up to resistance, the double top and trend reversal are still not complete. Breaking resistance from the highest point between the troughs completes the double bottom. This too should occur with an increase in volume and/or an accelerated ascent.
7. Resistance Turned Support: Broken resistance becomes potential support and there is sometimes a test of this newfound support level with the first correction. Such a test can offer a second chance to close a short position or initiate a long.
8. Price Target: The distance from the resistance breakout to trough lows can be added on top of the resistance break to estimate a target. This would imply that the bigger the formation is, the larger the potential advance.
It is important to remember that the double bottom is an intermediate to long-term reversal pattern that will not form in a few days. Even though formation in a few weeks is possible, it is preferable to have at least 4 weeks between lows. Bottoms usually take longer than tops to form and patience can often be a virtue. Give the pattern time to develop and look for the proper clues. The advance off of the first trough should be 10-20%. The second trough should form a low within 3% of the previous low and volume on the ensuing advance should increase. Volume indicators such as Chaikin Money Flow, OBV and Accumulation/Distribution can be used to look for signs of buying pressure. Just as with the double top, it is paramount to wait for the resistance breakout. The formation is not complete until the previous reaction high is taken out.
| Description: |
|
| Filesize: |
11.44 KB |
| Viewed: |
3426 Time(s) |
|
|
|
| Back to top |
|
|
casper
Green Belt
Joined: 02 Oct 2010
Posts: 1315
|
| Post: #39 Posted: Wed Oct 27, 2010 8:43 pm Post subject: |
|
|
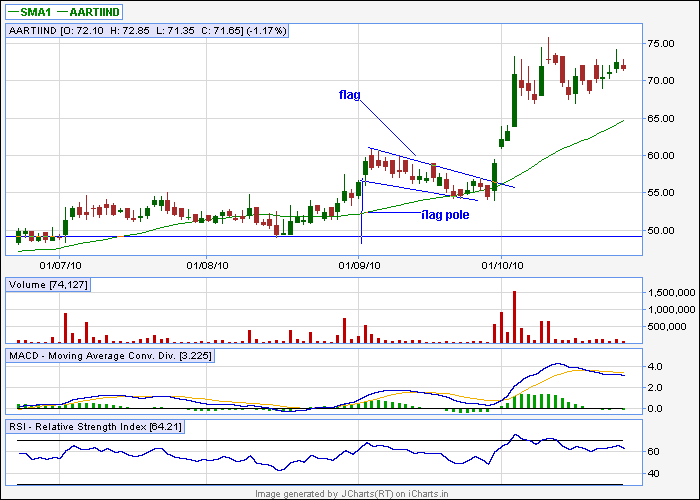
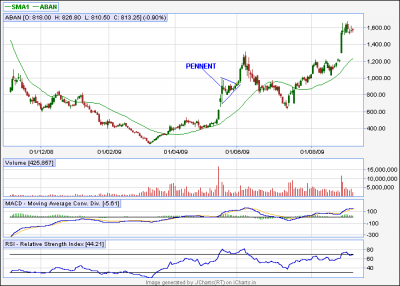
Flag, Pennant (Continuation)
Flags and Pennants are short-term continuation patterns that mark a small consolidation before the previous move resumes. These patterns are usually preceded by a sharp advance or decline with heavy volume, and mark a mid-point of the move.
IMPORTANT ASPECTS
1. Sharp Move: To be considered a continuation pattern, there should be evidence of a prior trend. Flags and pennants require evidence of a sharp advance or decline on heavy volume. These moves usually occur on heavy volume and can contain gaps. This move usually represents the first leg of a significant advance or decline and the flag/pennant is merely a pause. (UNLIKE SYMMETRICAL TRIANGLE-PROPER, WHERE SHARP MOVE MAY OR MAY NOT EXIST BEFORE FORMATION OF THE PATTERN)
2. Flagpole: The flagpole is the distance from the first resistance or support break to the high or low of the flag/pennant. The sharp advance (or decline) that forms the flagpole should break a trend line or resistance/support level. A line extending up from this break to the high of the flag/pennant forms the flagpole.
3. Flag: A flag is a small rectangle pattern that slopes against the previous trend. If the previous move was up, then the flag would slope down. If the move was down, then the flag would slope up. Because flags are usually too short in duration to actually have reaction highs and lows, the price action just needs to be contained within two parallel trend lines.
4. Pennant: A pennant is a small symmetrical triangle that begins wide and converges as the pattern matures (like a cone). The slope is usually neutral. Sometimes there will not be specific reaction highs and lows from which to draw the trend lines and the price action should just be contained within the converging trend lines.
5. Duration: Flags and pennants are short-term patterns that can last from 1 to 12 weeks. There is some debate on the time frame and some consider 8 weeks to be pushing the limits for a reliable pattern. Ideally, these patterns will form between 1 and 4 weeks. Once a flag becomes more than 12 weeks old, it would be classified as a rectangle. A pennant more than 12 weeks old would turn into a symmetrical triangle. The reliability of patterns that fall between 8 and 12 weeks is debatable.
6. Break: For a bullish flag or pennant, a break above resistance signals that the previous advance has resumed. For a bearish flag or pennant, a break below support signals that the previous decline has resumed.
7. Volume: Volume should be heavy during the advance or decline that forms the flagpole. Heavy volume provides legitimacy for the sudden and sharp move that creates the flagpole. An expansion of volume on the resistance (support) break lends credence to the validity of the formation and the likelihood of continuation.
8. Targets: The length of the flagpole can be applied to the resistance break or support break of the flag/pennant to estimate the advance or decline.
Even though flags and pennants are common formations, identification guidelines should not be taken lightly. It is important that flags and pennants are preceded by a sharp advance or decline. Without a sharp move, the reliability of the formation becomes questionable and trading could carry added risk. Look for volume confirmation on the initial move, consolidation and resumption to augment the robustness of pattern identification.
| Description: |
|
| Filesize: |
10.85 KB |
| Viewed: |
3371 Time(s) |
|
| Description: |
|
| Filesize: |
13.15 KB |
| Viewed: |
603 Time(s) |
|
|
|
| Back to top |
|
|
mrvishal_g
White Belt

Joined: 17 Sep 2010
Posts: 89
|
| Post: #40 Posted: Thu Oct 28, 2010 8:52 am Post subject: |
|
|
Hello Casper,
I would like to join you bcoz you are one of person who i am searching.
Firstly i indroducing myself.
My name is Vishal Gupta livingl in Delhi. I am MBA (finance) and i learn TA from Mr. Ashok Wadhwa (a 25+ years expirience trader cum teacher).
I am working as a Officer(account & finace) and want to start self trading full time but due to shortage of time bcoz of my job i am not able to give time to practice more in TA. But now onwards i will be in touch with you.
I want some friends like you so that i can discuss abt TA with them and get expirience.
Tell me something abt yourself.
Please comment on HCC i bought 1 lot at 63.5 (Nov expiry)
Thanks
Vishal
9999370378
|
|
| Back to top |
|
|
girishhu1
White Belt
Joined: 17 Aug 2009
Posts: 316
|
| Post: #41 Posted: Thu Oct 28, 2010 9:24 am Post subject: |
|
|
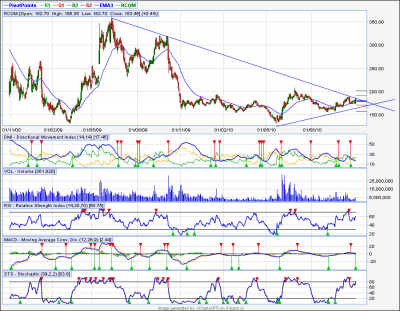
i m enclosing rcom chart. can this be considered as bo since it has taken place at the nd of triangle? kindly confirm with targets if any.
regards
girish
| Description: |
|
| Filesize: |
68.69 KB |
| Viewed: |
618 Time(s) |
|
|
|
| Back to top |
|
|
casper
Green Belt
Joined: 02 Oct 2010
Posts: 1315
|
| Post: #42 Posted: Thu Oct 28, 2010 9:47 am Post subject: |
|
|
MR VISHAL_G, welcome, will write after getting free, a lil bit busy in market 
girish, today if it closes above 185 with good vol then its a bo, the drawing of chart needs to be corrected a lil bit, i will post it after some time, (too busy bro )
target will be 195-200 for short term (say 2/3 days)
may reach up to 220-240 in mid term (15 days-1 month atleast)
|
|
| Back to top |
|
|
casper
Green Belt
Joined: 02 Oct 2010
Posts: 1315
|
| Post: #43 Posted: Thu Oct 28, 2010 9:56 am Post subject: |
|
|
forgot to write abt hcc 
on eod chart a symmetrical triangle is forming
support is seen at 61.50-62 range,(lower bb and lower tl support--- i think a strong support) if its breached then it will be a break down and may go down up to 60,58
if it takes sup at this level and goes up then target 65,70,72, ( while 65 will be the bo point,--- a crucial resistance)
|
|
| Back to top |
|
|
newinvestor
White Belt
Joined: 16 Feb 2010
Posts: 120
|
| Post: #44 Posted: Thu Oct 28, 2010 10:37 am Post subject: Great Job |
|
|
Dear Casper,
thanks for the detailed guidance on the brakout patterns.
After going thru your material a few times, it is very clear now.
Just a couple of questions.
1. Is the difference between a rounded bottom and a cup and handle that the rounded bottom will break above the right rim of the cup without a resistance ( thereby not forming a handle), whereas the cup and handle will pull back a bit (hav some rsistance at the right rim ) thereby forming a handle?
In the charts of Cosmo Films, a couple of weeks back, it broke above the right rim without a handle, whereas a few days back, it formed a handle (would appreciate if you can get the time to check the chart)
Thanks
|
|
| Back to top |
|
|
casper
Green Belt
Joined: 02 Oct 2010
Posts: 1315
|
| Post: #45 Posted: Thu Oct 28, 2010 11:37 am Post subject: |
|
|
at first i must mention that classical cup and handle and round bottom, both are long term consolidation patterns, so the chart of cosmo films is not an classical formation, as i mentioned during the description of those patterns that if they form over a short term of period then they will remain doubtful,
as they are doubtful,(u can see that instead of consolidating around 3% level of the bo--- which happens in general case of cup and handle, it starting consolidation after clearing the bo resistance with high vol and momentum---- its quite uncommon in classical case)
now its doubtful, but not non-tradable, as long as it respects the bo level as a strong support, it will go up surely, so i suggested rashmi (who asked the question) to use bo level viz 160 by closing as a stop loss, and after taking support here, it resumed the upmove
EXAMPLE
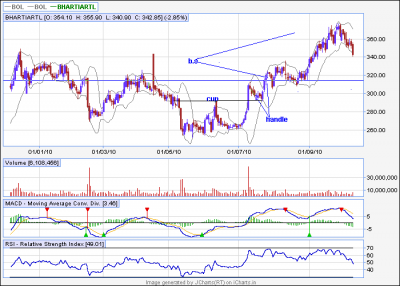
now let us "trade" an example of this kind of stock, example is bhartiartl,
i will try to describe here what may happen during the formation of the pattern and what we are supposed to do.
1. we will enter the stock as soon as it clears the REACTION RALLY TOP at 280
2. after that the stock faces resistance at the bo level and starts consolidating, we will use it as a chance of accumulation
3.we are accumulating and stock is going down, simply we are getting worried, how long shall we accumulate a declining scrip???
4.the answer is as long as it decline within 1/3 of the previous advance, (as i mentioned during the general description of cup and handle, that handle may decline up to 1/3 of the cup's right arm expansion)
5.or else, simply join the reaction highs of the pattern and extend it, it will show u a strong support zone,(look at the chart)
6.here i mention a very simple fact about the trend lines, the angle of inclination is inversely proportionate with the possible support/resistance, the less it inclined(or declined) the more its strength, in our case , its a flat line, so the support here will be maximum
7. so this will be our LAXMAN REKHA to hold/accumulate the stock
8. and the when the stock touched the trend line, its blasting like a hell
I WROTE ALL THESE FOR U IF U R AN INVESTOR WITH A MID TO LONG TERM PERSPECTIVE, IF U R A SHORT TERM OR VERY SHORT TERM TRADER, THEN JUST FORGET ABOUT ALL THOSE DRAMA (LOL) AND ENTER ONLY AFTER THE HANDLE BREAK OUT.
ask me if u have any more question
| Description: |
|
| Filesize: |
29.37 KB |
| Viewed: |
592 Time(s) |
|
|
|
| Back to top |
|
|
|
|
You cannot post new topics in this forum
You cannot reply to topics in this forum
You cannot edit your posts in this forum
You cannot delete your posts in this forum
You cannot vote in polls in this forum
You can attach files in this forum
You can download files in this forum
|
Powered by phpBB © 2001, 2005 phpBB Group
|
|
|


