| View previous topic :: View next topic |
| Author |
a layman's approach to break out and break down |
rk_a2003
Black Belt

Joined: 21 Jan 2010
Posts: 2734
|
Post: #3016  Posted: Sat Feb 11, 2012 7:07 pm Post subject: Posted: Sat Feb 11, 2012 7:07 pm Post subject: |
 |
|
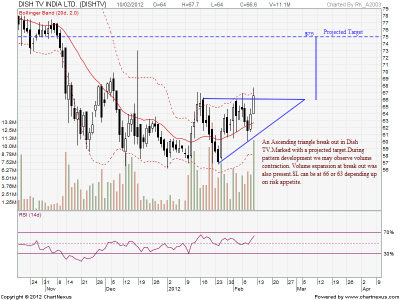
DISH TV registered an ascending triangle break out. Have a look at the chart with self explanation.
| Description: |
|
| Filesize: |
42.78 KB |
| Viewed: |
757 Time(s) |
|
|
|
| Back to top |
|
 |
|
|
|
vinay28
Black Belt
Joined: 24 Dec 2010
Posts: 11748
|
| Post: #3017 Posted: Sat Feb 11, 2012 7:33 pm Post subject: |
|
|
| RK, don't you think breakout is premature?
|
|
| Back to top |
|
|
rk_a2003
Black Belt
Joined: 21 Jan 2010
Posts: 2734
|
| Post: #3018 Posted: Sat Feb 11, 2012 8:06 pm Post subject: |
|
|
Vinay
As per theory it is not premature.It's almost a bookish pattern. But in the given market conditions one may wait for a second day confirmation.
How ever let me know why do you think it's a premature one?.
|
|
| Back to top |
|
|
vinay28
Black Belt
Joined: 24 Dec 2010
Posts: 11748
|
| Post: #3019 Posted: Sat Feb 11, 2012 9:04 pm Post subject: |
|
|
| because I think it has crossed UTL too early. as u said, it should go close above previous high for another confirmation
|
|
| Back to top |
|
|
chandrujimrc
Brown Belt

Joined: 21 Apr 2009
Posts: 1683
|
| Post: #3020 Posted: Tue Feb 14, 2012 8:48 pm Post subject: |
|
|
Dear Casper/Seniors,
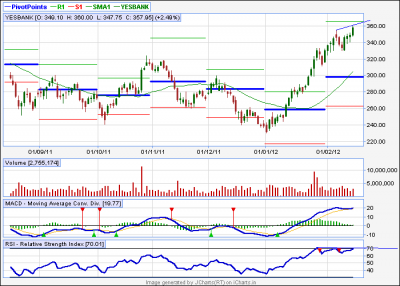
As per Yesbank EOD chart(-ve divergence),is it advisable to go short at cmp?
chandru.
| Description: |
|
| Filesize: |
13.73 KB |
| Viewed: |
693 Time(s) |
|
|
|
| Back to top |
|
|
vinay28
Black Belt
Joined: 24 Dec 2010
Posts: 11748
|
| Post: #3021 Posted: Tue Feb 14, 2012 9:04 pm Post subject: |
|
|
| rk, what's status of dish tv? just out of curiosity
|
|
| Back to top |
|
|
Arjun20
Yellow Belt

Joined: 23 Jun 2011
Posts: 945
|
| Post: #3022 Posted: Tue Feb 14, 2012 9:17 pm Post subject: |
|
|
| chandrujimrc wrote: | Dear Casper/Seniors,
As per Yesbank EOD chart(-ve divergence),is it advisable to go short at cmp?
chandru. |
Dear Chandru
Set up is pre-mature to check for Divergence...rather -ve div.
At second top/high, there's a green candle. That's why i feel it's premature.U can check for div when u get indication of topping out on second top/high. Today's close do not give such indication.
|
|
| Back to top |
|
|
singh.ravee
Yellow Belt
Joined: 12 Aug 2010
Posts: 678
|
| Post: #3023 Posted: Tue Feb 14, 2012 9:31 pm Post subject: |
|
|
| chandrujimrc wrote: | Dear Casper/Seniors,
As per Yesbank EOD chart(-ve divergence),is it advisable to go short at cmp?
chandru. |
chandru,
why u wish to short a stock which otherwise is in uptrend.
rgds
ravee
|
|
| Back to top |
|
|
chandrujimrc
Brown Belt
Joined: 21 Apr 2009
Posts: 1683
|
| Post: #3024 Posted: Tue Feb 14, 2012 10:07 pm Post subject: |
|
|
Dear Arjun/Singh.Ravee,
Thanks for your comments.Yes bank nearing resistance lvl after huge rally with -ve divg.Thats why I am expecting short.
chandru.
|
|
| Back to top |
|
|
Padkondu
White Belt

Joined: 23 Jan 2008
Posts: 120
|
| Post: #3025 Posted: Tue Feb 14, 2012 11:10 pm Post subject: |
|
|
| chandrujimrc wrote: | Dear Arjun/Singh.Ravee,
Thanks for your comments.Yes bank nearing resistance lvl after huge rally with -ve divg.Thats why I am expecting short.
chandru. |
Dear Chandru,
I would like to remind that divergence are a common place in very strong trends because price can move any where but indicator value can not move on par with price, i.e. rsi can not move above 100 or below 0.
Wilder in his own words said; "Before getting too excited about divergences as great trading signals, it must be noted that divergences are misleading in a strong trend. A strong uptrend can show numerous bearish divergences before a top actually materializes. Conversely, bullish divergences can appear in a strong downtrend - and yet the downtrend continues."
let us now consider the concept of failure swings. this is not invented by me. this is explained by J w wilder.
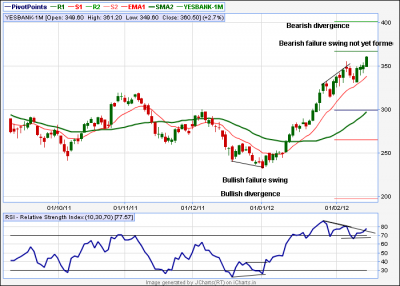
Wilder also considered failure swings as strong indications of an impending reversal. Failure swings are independent of price action. In other words, failure swings focus solely on RSI for signals and ignore the concept of divergences. A bullish failure swing forms when RSI moves below 30 (oversold), bounces above 30, pulls back, holds above 30 and then breaks its prior high. this happened during dec-2011. RSI moved below 30, bounded above 30 on 03-01-2012, remained above 30 and then broken the prior high on third itself a long at the open on 4th could have given great profit.
A bearish failure swing forms when RSI moves above 70, pulls back, bounces, fails to exceed 70 and then breaks its prior low. It is basically a move to overbought levels and then a lower high below overbought levels. Considering the period from 25-01-2012 to till date this has not happened. more over the rsi has taken off the trend line drawn over rsi during this period.
with all this i do not mean that a reversal can not happen here. who know what is in store? but tradin is a game of probability. there is more probability for an upward move.
further what is the resistancel level you said? pl let me know i am long is yes bank, atleast till 375.
regards
padkondu
| Description: |
|
| Filesize: |
24.05 KB |
| Viewed: |
718 Time(s) |
|
|
|
| Back to top |
|
|
thegani
White Belt
Joined: 03 Nov 2010
Posts: 21
|
| Post: #3026 Posted: Tue May 08, 2012 12:47 pm Post subject: Cairn India Short sell |
|
|
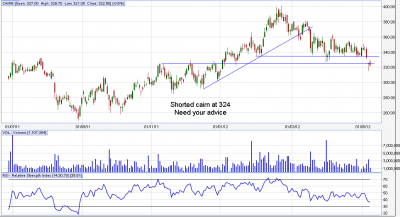
Please comment
| Description: |
|
| Filesize: |
62.57 KB |
| Viewed: |
750 Time(s) |
|
|
|
| Back to top |
|
|
t.chatterjee
White Belt
Joined: 07 May 2010
Posts: 66
|
| Post: #3027 Posted: Tue May 08, 2012 7:36 pm Post subject: Re: Cairn India Short sell |
|
|
| thegani wrote: | | Please comment |
just be careful at 313 viz at todays low, its a strong support level ( monthly s2)
if it this is broken tomorrow we can see 305-304 and then 290-286 levels in short term
if u hv multiple lots, try to book one around 313 if u get this price, then book another at 305 and so on, keep trailing ur sl as u book
as per the pattern, i wud say perfect finding
casper

|
|
| Back to top |
|
|
rk_a2003
Black Belt
Joined: 21 Jan 2010
Posts: 2734
|
| Post: #3028 Posted: Tue May 08, 2012 8:18 pm Post subject: |
|
|
Welcome back Tushar Chatterjee( Casper )
Casper is very much missed here.Where are you? Busy with your works.
Kindly excuse us in case we offended you. It’s no way intentional.
May I request you for an overview of nifty charts.I remember long back your chart reading predicted a possible big fall, any such indication/further confirmation from T.A?..
|
|
| Back to top |
|
|
S.S.
White Belt
Joined: 09 Feb 2011
Posts: 241
|
| Post: #3029 Posted: Tue May 08, 2012 8:35 pm Post subject: |
|
|
| welcome back dada......
|
|
| Back to top |
|
|
t.chatterjee
White Belt
Joined: 07 May 2010
Posts: 66
|
| Post: #3030 Posted: Tue May 08, 2012 9:43 pm Post subject: |
|
|
hi rk and ss, thanks and welcome
and it was no way offense 
lets forget the past and lets concentrate on what the future holds for nifty!!
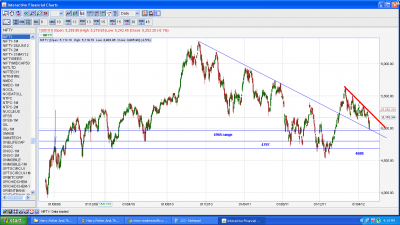
nifty situation is very bad we are on a very important support level and apparently we are going to gap down below it tomorrow itself
its around 4965 range as we can see two trend lines are joining there so we can expect strong support here and once decisively broken, we will hv a strong resistance to cross also .
below 4965, support will be available at 4797 and 4688 spot levels
supports will come and go but breaking below 4965 will hv a consequence
u can see the slanting down trend line which we get by connecting all the highs right from 6300 ............. all the highs except the recent high
so that tl represents the basic down trend we were into, hence, breaking below that tl and staying there, would only confirm the down trend
since this one is a big trend line, we may use 3 days rule to confirm the trend, 3rd rules viz, if we get 3 trading days close below that tl, we may consider that we are back in down trend
but suppose we dont break it, by any means and hold it , move up and break the small red trend line , which is the present smaller down trend line, in that case, we will rise up again
| Description: |
|
| Filesize: |
100.27 KB |
| Viewed: |
763 Time(s) |
|
|
|
| Back to top |
|
|
|


