|
|
| View previous topic :: View next topic |
| Author |
a layman's approach to break out and break down |
casper
Green Belt

Joined: 02 Oct 2010
Posts: 1315
|
Post: #346  Posted: Sun Nov 21, 2010 11:36 am Post subject: Re: my analysis Posted: Sun Nov 21, 2010 11:36 am Post subject: Re: my analysis |
 |
|
| singh.ravee wrote: | dear casper,
would like to share my research work in the attached file. As u said, there is an analyst and a trader in an individual. The analyst in me is doing a good job, however the trader in me is failing most of the time. I fail to understand, when to trade intraday and when to trade on positional basis. My losses are primarily from intraday trades.
This time I was sure on opening short on nifty from 6250+ levels. However my teacher discouraged my view. I lost my frame of mind to open short and now i find nifty close to 5900 and i feel upset.
It would be nice on your part if u can guide me on the same.
Thanks and Regards
Ravinder Singh. |
hi ravee. i have got the excel sheet u posted, now after examining i will post what i understand
|
|
| Back to top |
|
 |
|
|  |
Rahulsharmaat
Black Belt

Joined: 04 Nov 2009
Posts: 2766
|
Post: #347  Posted: Sun Nov 21, 2010 11:37 am Post subject: Posted: Sun Nov 21, 2010 11:37 am Post subject: |
 |
|
| Casper i too want your Guidelines pls see my post also
|
|
| Back to top |
|
 |
casper
Green Belt

Joined: 02 Oct 2010
Posts: 1315
|
Post: #348  Posted: Sun Nov 21, 2010 12:17 pm Post subject: Posted: Sun Nov 21, 2010 12:17 pm Post subject: |
 |
|
| Rahulsharmaat wrote: | Same is with me-- I post calls-- all hit good targets-- but as a trader i dont follow them-- n the stop losses--- when i ask others to book profit--0-they follow-- but i dont follow my words n result is huge loss--- how to over come this---
I posted a chart to short nifty-- where as i bought it--- all thanked me for short-- n i lost
oh god |
it seems that when u annalise u stay clam and composed, but when in real market u easily get overawed by the market movements and get an itchy hand to jump on what appear to u proper and fit at the moment and forget all about the research u have done earlier.
it happened to me also. i used to get nervous by the price movement and used to do things just opposite to my research
then i found my answer to this problem, a very simple and very effective one. i was enthusiastic when i started trading and made so many loss. now i am so reluctant to take a trade and while my one part is reluctant, another part of myself try to convince me to trade, and the result is BEFORE ENTERING A TRADE, I CLEARLY NOTE DOWN THE REASON WHY I AM TAKING THIS TRADE. while i write, i get a clear picture of what i am doing, so no chance of getting overawed by the movements, because now i dont get impressed by the profit prospect. i trade like a machine, if there is sufficient reason to believe in a trade, then only i take a trade
if u dont mind then i would say, earlier, after finding an ascending triangle, my inner voice used to be "i got a nice ascending triangle, it will give me 10 rupees bo within 10 minutes, no matter that macd is in sell mode and rsi is going down. its an ascending triangle after all " then i jumped and got doomed.
now my inner voice says" here it looks like an ascending triangle....... ok ok let it be, who cares?.....have a cup of tea,..... look macd is in buy mode........so what? where is my cigarettes?..... rsi also rising from the oversold position......ok.ok,its better to loose 500 as sl than sit like an idiot. ok lets trade.... i am too bored with smoking and sitting...... ok boy.... i am trading.....just for a change.....but mind u the 1st and last .... no more trading after this" this way i trade,and make my livings also
so plz make it an point to write down the reasons to take a trade before u take one, there is lot of opportunity, if u get late and lose one, there is another one waiting for u, so never be in hurry while trading
WHEN ST SIR STARTED HIS EXAMPLE THREAD, WE WERE ALL VERY ENTHUSIASTIC WITH THE METHOD, BUT THEN, THAT LEGENDARY TRADER TOLD US " U ARE ALL TOO ENTHUSIASTIC, I AM AFRAID U R TOO OPTIMISTIC TO BE A GOOD TRADER. TO BECOME GOOD TRADERS U NEED TO APPLY THIS METHOD AND GET BORED. THAT WILL SHOW U THAT U R ON RIGHT PATH"
i dont remember his exact wordings, but the meaning was some thing like that. and it is so true
|
|
| Back to top |
|
 |
girishhu1
White Belt

Joined: 17 Aug 2009
Posts: 316
|
Post: #349  Posted: Sun Nov 21, 2010 12:31 pm Post subject: Posted: Sun Nov 21, 2010 12:31 pm Post subject: |
 |
|
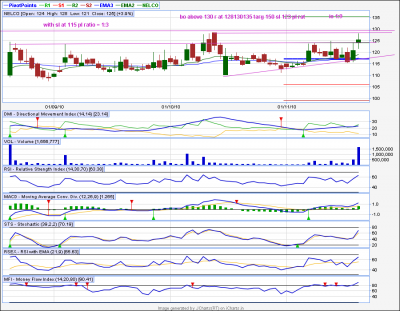
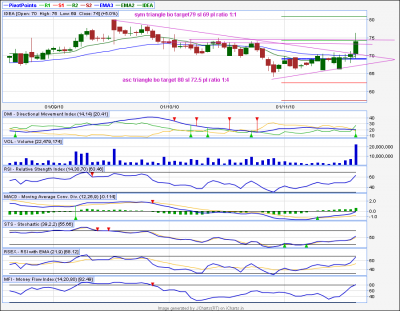
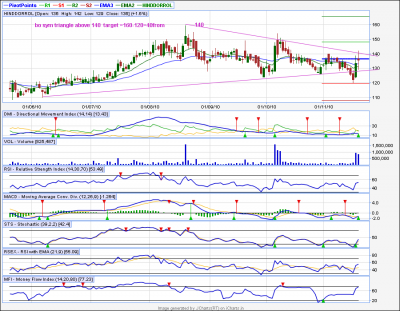
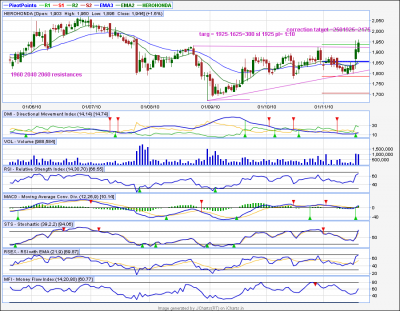
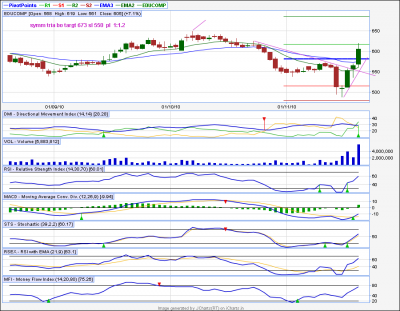
hi casperji,
i am posting a few charts. kindly comment on them.
| Description: |
|
| Filesize: |
57.62 KB |
| Viewed: |
348 Time(s) |
|
| Description: |
|
| Filesize: |
60.38 KB |
| Viewed: |
376 Time(s) |
|
| Description: |
|
| Filesize: |
57.63 KB |
| Viewed: |
350 Time(s) |
|
| Description: |
|
| Filesize: |
60.55 KB |
| Viewed: |
330 Time(s) |
|
| Description: |
|
| Filesize: |
54.96 KB |
| Viewed: |
355 Time(s) |
|
|
|
| Back to top |
|
 |
Rahulsharmaat
Black Belt

Joined: 04 Nov 2009
Posts: 2766
|
Post: #350  Posted: Sun Nov 21, 2010 12:35 pm Post subject: Posted: Sun Nov 21, 2010 12:35 pm Post subject: |
 |
|
Thanks casper-- after failures i always decide to be strict but that goes in few days
last i decided to trade with 3 ema-- 7 ema-- 34 ema--- on 30 min as positional
5--13--34 Ema -- in 5 min intraday trades--
back tested all these for months---excellent results
as few trades get loss also-- but net result is 350 points plus gain in Nifty every month-- as well 800 points in bank nifty
Tracked-- Educomp--- Sesa goa-- Lt-- Sbin-- Dlf---Sterite
But problem is if first few trades make loss-- i decide to stop this-- which is wrong--
On my I chart i have only these stocks nothing else-- but instead of trading them i trade others--
all these stocks along with nifty n bank nifty gave good shorts--
problem with me is i hold position long 10% down also-- but cany stay short even i see 1 Rs up--that gives panic in mind--
how to over come this
sure from monday wont trade anything besides my reserch--
after nifty n bank nifty back testing on these EMA for over 10 years time frame i decided to trade but gave up few months ago--
plan was to start with 1 lot-- trade for 3 months and then increase lot size 50% everymonth for next 5 years-- no other system except this-- all traded long --short generated i will trade-- after 5 years will retire as will have huge gains--
so bless me that from tom i trade in that style only
|
|
| Back to top |
|
 |
Rahulsharmaat
Black Belt

Joined: 04 Nov 2009
Posts: 2766
|
Post: #351  Posted: Sun Nov 21, 2010 12:47 pm Post subject: Posted: Sun Nov 21, 2010 12:47 pm Post subject: |
 |
|
Educomp gave short call on 25th Oct at 611--on 2nd Nov gave booking of short at 545-- now go long at 545 same time exit long at 551-- again short at 551--exit short at 553--- now long at 553--on 8th Nov--Book long at 567 on 10th Nov-- go short at 567 now--cover short at 508-- on 15 Nov-- go long at 508 now--book long at 547 on 18th --go short at 547--agin book short at 548-- same day n go long at 548--till now its hold at 600
this all is tracked on 3--7 ema cross over in 30 min--
Resulting in gain of Rs 232 in a lot of 500 thats 115000 gain in 20 days---
n caspher i missed it as at 611-- everywhere people -- analysts said 660--- at 500 all said 450-- now again at 600 all saying break out---
oh god
|
|
| Back to top |
|
 |
casper
Green Belt

Joined: 02 Oct 2010
Posts: 1315
|
Post: #352  Posted: Sun Nov 21, 2010 12:53 pm Post subject: Posted: Sun Nov 21, 2010 12:53 pm Post subject: |
 |
|
| newinvestor wrote: | as of now, there is no way to get a list of stock before their bo and volume gain, so if we want to do it. then we have to do it manually. no help is on website now.
Ok. What do you think can be a good process for this work of pattern identification , while under formation?
I looked at Spice jet, I felt that it can do one of two things, either go upto its previous high of 94 and try for a break out there, or form the right shoulder till about 87, and then retreat below the neckline at 82.
What can be the starting point for this process, find stocks with rising RSI etc, and look for any patterns or identify any pattern being formed and then reconcile with the Oscillators?
What should be the stoploss if one enters a trade in a pattern under formation? maybe the other trendline? |
when u are trading positionally, u start with volume/price expansion lists. open up the list and corresponding charts. then try to find the pattern by drawing trend lines.(which is responsible for the break out.) then check macd and finally check rsi
if every thing is ok then take the trade with the sl below the trend line it broken to give the bo. (being lazy. i do it or else i have to see hundred of charts to find out which may give bo one by one)
during intraday trading i cant help but have to see each of the chart. i open them one after another by simply selecting the 1st symbol and the pressing the down arrow. i use 60 minute charts and concentrate on the right hand side of the chart where the latest candles are present. i consider only 5-10 candles because i dont like expanded patterns. an expanded pattern 60 min tf, which is formed with 15-20 candles looks horrible for me. it means it has taken 15-20 trading hours to form, now god knows when the bo/ bd will occur. so i try to find small, clean. robust patterns so that a small but confirmed bo takes place within intraday trading
at this stage though i am mentally prepared to see all the charts this way, but sooner or later i find one or two of my choice and as i dont need lot of trading, so i then concentrate to see the macd and rsi and after getting confirmation i trade.
here for stop loss purpose some time i use lower tls of bo pattern or upper tl of bd pattern. 89/34 ema. s1-s3 levels or r1-r3 levels of i chart levels
|
|
| Back to top |
|
 |
casper
Green Belt

Joined: 02 Oct 2010
Posts: 1315
|
Post: #353  Posted: Sun Nov 21, 2010 12:59 pm Post subject: Posted: Sun Nov 21, 2010 12:59 pm Post subject: |
 |
|
| geetlasandeep wrote: | | dear casper, i want to know about charts and how to read them.i do trading in indiainfoline.i see the graph but i don't know how to plot on that.well, to say frankly,iam a beginner.i request you to kindly guide me.regards,sandeep. |
hi sandeep, plz find an attachment. its an e book, plz read it carefully because without reading u wont be able to have a good grip on the subject, once u finish it we can carry out discussion on further details
rahul, girish bhaiya, plz wait i am replying
| Description: |
|

Download |
| Filename: |
glossary_of_candle_stick_signals_523.pdf |
| Filesize: |
744.63 KB |
| Downloaded: |
461 Time(s) |
|
|
| Back to top |
|
 |
maooliservice
White Belt

Joined: 04 Aug 2010
Posts: 93
|
Post: #354  Posted: Sun Nov 21, 2010 7:45 pm Post subject: Few queries Posted: Sun Nov 21, 2010 7:45 pm Post subject: Few queries |
 |
|
Dear caspersir
I have few queries.pls explain me.
can u explain in detail were to see volume/price expansion list in positional trading and how to select bo/bd stocks for trading.also pls explain in detail how to find bo/bd by seeing 60m tfm chart candles.
if possible can u explain with few charts
| casper wrote: | | newinvestor wrote: | as of now, there is no way to get a list of stock before their bo and volume gain, so if we want to do it. then we have to do it manually. no help is on website now.
Ok. What do you think can be a good process for this work of pattern identification , while under formation?
I looked at Spice jet, I felt that it can do one of two things, either go upto its previous high of 94 and try for a break out there, or form the right shoulder till about 87, and then retreat below the neckline at 82.
What can be the starting point for this process, find stocks with rising RSI etc, and look for any patterns or identify any pattern being formed and then reconcile with the Oscillators?
What should be the stoploss if one enters a trade in a pattern under formation? maybe the other trendline? |
when u are trading positionally, u start with volume/price expansion lists. open up the list and corresponding charts. then try to find the pattern by drawing trend lines.(which is responsible for the break out.) then check macd and finally check rsi
if every thing is ok then take the trade with the sl below the trend line it broken to give the bo. (being lazy. i do it or else i have to see hundred of charts to find out which may give bo one by one)
during intraday trading i cant help but have to see each of the chart. i open them one after another by simply selecting the 1st symbol and the pressing the down arrow. i use 60 minute charts and concentrate on the right hand side of the chart where the latest candles are present. i consider only 5-10 candles because i dont like expanded patterns. an expanded pattern 60 min tf, which is formed with 15-20 candles looks horrible for me. it means it has taken 15-20 trading hours to form, now god knows when the bo/ bd will occur. so i try to find small, clean. robust patterns so that a small but confirmed bo takes place within intraday trading
at this stage though i am mentally prepared to see all the charts this way, but sooner or later i find one or two of my choice and as i dont need lot of trading, so i then concentrate to see the macd and rsi and after getting confirmation i trade.
here for stop loss purpose some time i use lower tls of bo pattern or upper tl of bd pattern. 89/34 ema. s1-s3 levels or r1-r3 levels of i chart levels |
|
|
| Back to top |
|
 |
mrvishal_g
White Belt

Joined: 17 Sep 2010
Posts: 89
|
Post: #355  Posted: Sun Nov 21, 2010 8:03 pm Post subject: Posted: Sun Nov 21, 2010 8:03 pm Post subject: |
 |
|
| SwingTrader wrote: | mrvishal_g,
Do not post links to copyrighted content here. Your previous posts have been removed. |
Noted ST sir
|
|
| Back to top |
|
 |
mrvishal_g
White Belt

Joined: 17 Sep 2010
Posts: 89
|
Post: #356  Posted: Sun Nov 21, 2010 8:58 pm Post subject: Posted: Sun Nov 21, 2010 8:58 pm Post subject: |
 |
|
Hello Casper,
Please comment on
GTL 417....Sell below 410 (decending tringle, it is near to bd)
HindZink 1177.....buy sl 1170 (bb as well as trendline support)
Bata India 362---Buy
(assending trindgle came back to bo level)
Vishal 
|
|
| Back to top |
|
 |
girishhu1
White Belt

Joined: 17 Aug 2009
Posts: 316
|
Post: #357  Posted: Sun Nov 21, 2010 10:57 pm Post subject: Posted: Sun Nov 21, 2010 10:57 pm Post subject: |
 |
|
hellow casperji,
the pl ratio mentioned in charts is for risk reward ratio. these are taken at approximate values. this is for your info only. waiting for your reply.
regards,
girish
|
|
| Back to top |
|
 |
thegani
White Belt

Joined: 03 Nov 2010
Posts: 21
|
Post: #358  Posted: Mon Nov 22, 2010 12:31 am Post subject: Posted: Mon Nov 22, 2010 12:31 am Post subject: |
 |
|
| casper wrote: | | geetlasandeep wrote: | | dear casper, i want to know about charts and how to read them.i do trading in indiainfoline.i see the graph but i don't know how to plot on that.well, to say frankly,iam a beginner.i request you to kindly guide me.regards,sandeep. |
hi sandeep, plz find an attachment. its an e book, plz read it carefully because without reading u wont be able to have a good grip on the subject, once u finish it we can carry out discussion on further details
rahul, girish bhaiya, plz wait i am replying |
thank u sir ji for this book
|
|
| Back to top |
|
 |
drsureshbs
White Belt

Joined: 22 Oct 2008
Posts: 58
|
Post: #359  Posted: Mon Nov 22, 2010 12:34 am Post subject: Posted: Mon Nov 22, 2010 12:34 am Post subject: |
 |
|
[quote="mrvishal_g"] | SwingTrader wrote: | mrvishal_g,
Do not post links to copyrighted content here. Your previous posts have been removed. |
Noted ST sir[/quote
mrvishal _g AND ST honestly i dont know what this copy right all about . when the intension is guinine they should b encouraged.if possible repost it editing the copy right aspect .and hope ST doest mind it . CASPER THE NO OF PAGES ITSELF INDICATE THE POPULARITY OF THE THREAD.Casper no question means things r simple to b uderstood by every body.Ur thead has grown so fast i find it hard to catch with it .only SAIKATS NVK AND CHROMES BO BD HAD MORE PAGES AND MORE DISCUSSION KEEP IT UP
|
|
| Back to top |
|
 |
girishhu1
White Belt

Joined: 17 Aug 2009
Posts: 316
|
Post: #360  Posted: Mon Nov 22, 2010 6:54 am Post subject: Posted: Mon Nov 22, 2010 6:54 am Post subject: |
 |
|
hellow casperji,
i have rechecked the intraday charts of idea, hero honda and educomp. and found that all these stocks are in overbought zone , on 60 m t/f. so after initial noise these stocks may come down a little bit. hence for todays trading strategy, we should wait untill they reach at 13 ema on 1 hr t/f and then go long with a stop loss at just below 34 ema on 1 hr tf. accordingly the sl and rr (pl) ratio considered in charts posted earlier by me, will have to be modified. kindly confirm.
regards
girish
|
|
| Back to top |
|
 |
|
|
You cannot post new topics in this forum
You cannot reply to topics in this forum
You cannot edit your posts in this forum
You cannot delete your posts in this forum
You cannot vote in polls in this forum
You can attach files in this forum
You can download files in this forum
|
Powered by phpBB © 2001, 2005 phpBB Group
|
|
|

