| View previous topic :: View next topic |
| Author |
a layman's approach to break out and break down |
casper
Green Belt

Joined: 02 Oct 2010
Posts: 1315
|
Post: #376  Posted: Mon Nov 22, 2010 11:15 pm Post subject: Posted: Mon Nov 22, 2010 11:15 pm Post subject: |
 |
|
hi sumesh
both of the charts are looking promising, let us see what is the result. dr reddy closed at higher level but still the pattern is intact
i am really happy to see that u have taken initiative to test the set up, in fact by repeated using this we can learn about its pros and cons and then we can develop more robust set ups in order to make ourselves more successful traders
|
|
| Back to top |
|
 |
|
|
 |
yawalkar
White Belt

Joined: 02 Oct 2010
Posts: 58
|
Post: #377  Posted: Tue Nov 23, 2010 7:29 am Post subject: New member in ichart Posted: Tue Nov 23, 2010 7:29 am Post subject: New member in ichart |
 |
|
Dear Casper,
I am new member of i chart. I want to learn T.A. in detail.
Pls. help me. I have downloaded the e book which you suggest in your previous posts.
I want to know following.
1. You are giving your ideas on various subjects of T.A. can you suggest in a sequence to understand easily.? I mean do you have such a data of your posts in sequence.?
2. You are using various short forms. What is it mean i don't know. Will you help me in this regards.
Pls. guide me..
Thanks in advanace.
|
|
| Back to top |
|
 |
casper
Green Belt

Joined: 02 Oct 2010
Posts: 1315
|
Post: #378  Posted: Tue Nov 23, 2010 8:12 am Post subject: Re: New member in ichart Posted: Tue Nov 23, 2010 8:12 am Post subject: Re: New member in ichart |
 |
|
| yawalkar wrote: | Dear Casper,
I am new member of i chart. I want to learn T.A. in detail.
Pls. help me. I have downloaded the e book which you suggest in your previous posts.
I want to know following.
1. You are giving your ideas on various subjects of T.A. can you suggest in a sequence to understand easily.? I mean do you have such a data of your posts in sequence.?
2. You are using various short forms. What is it mean i don't know. Will you help me in this regards.
Pls. guide me..
Thanks in advanace. |
i have not got any teacher in proper sense and followed various websites and senior trader's blog to learn. i have followed the following sequence (unknowingly)
i started with candle stick patterns, in that e book u will see lots of patterns, among them try to learn a few which are marked as dependable
after that i learned bb concept and usage of simple indicators like rsi. macd, stoch etc
then slowly i learned various chart patterns like triangles, double top. head and shoulder etc
this thread is particularly focused on various patterns which are responsible for break out/ break downs, u can find the general descriptions and basic approach to making a target and trading decision from this thread. u plz read the book and try to learn the patterns when u r down, just post me if u want to learn bb and then check this thread u will get the general description of patterns in the mean time if u need any help , just ask me, i will tell u whatever lil bit i know.
i generally use the following short forms
ascending triangle = at
descending triangle=dt
bollinger band=bb
head and shoulder= h/s
symmetrical triangle= sym tri and so on, if u find any thing else in short form just post the term, i will explain
|
|
| Back to top |
|
 |
Dutt
White Belt

Joined: 01 Nov 2010
Posts: 118
|
Post: #379  Posted: Tue Nov 23, 2010 8:14 am Post subject: how to trade in intraday Posted: Tue Nov 23, 2010 8:14 am Post subject: how to trade in intraday |
 |
|
Dear Friends,
Iam new to icharts, and i would require some help and advise , direction to read TA and how to trade in intraday?
Thanks and Regards
Shiv
|
|
| Back to top |
|
 |
singh.ravee
Yellow Belt

Joined: 12 Aug 2010
Posts: 678
|
Post: #380  Posted: Tue Nov 23, 2010 10:07 am Post subject: intraday trade Posted: Tue Nov 23, 2010 10:07 am Post subject: intraday trade |
 |
|
hi casper,
thank you so much for your kind words.
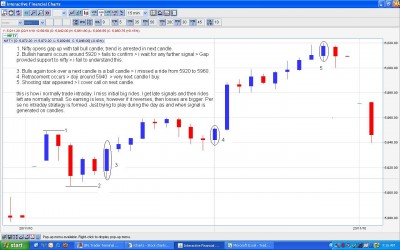
i am basic member of i charts and i have iifl account for intraday charts. I am attaching one of intraday chart of nifty for 22 nov 2010 on 15 min time frame. kindly share your observations and comments
rgds
ravee
| Description: |
|
| Filesize: |
149.81 KB |
| Viewed: |
325 Time(s) |
|
|
|
| Back to top |
|
 |
sumesh_sol
Brown Belt

Joined: 06 Jun 2010
Posts: 2344
|
Post: #381  Posted: Tue Nov 23, 2010 10:08 am Post subject: RENUKA 60tf Posted: Tue Nov 23, 2010 10:08 am Post subject: RENUKA 60tf |
 |
|
RENUKA..
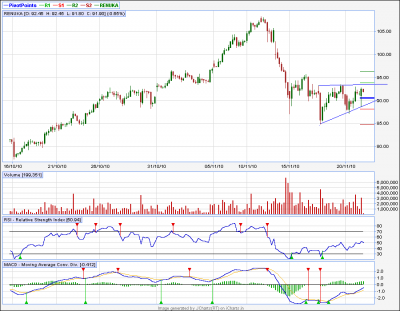
On 60tf , it is making Ascending triangle, and today is one of the most traded security(so far !)..
As per setup, the target could be 100 (93 + 8 (which is max. distance in the setup) )
Hope it works...
-Sumesh
| Description: |
|
| Filesize: |
19.7 KB |
| Viewed: |
309 Time(s) |
|
|
|
| Back to top |
|
 |
sumesh_sol
Brown Belt

Joined: 06 Jun 2010
Posts: 2344
|
Post: #382  Posted: Tue Nov 23, 2010 10:20 am Post subject: Re: RENUKA 60tf Posted: Tue Nov 23, 2010 10:20 am Post subject: Re: RENUKA 60tf |
 |
|
| sumesh_sol wrote: | RENUKA..
On 60tf , it is making Ascending triangle, and today is one of the most traded security(so far !)..
As per setup, the target could be 100 (93 + 8 (which is max. distance in the setup) )
Hope it works...
-Sumesh |
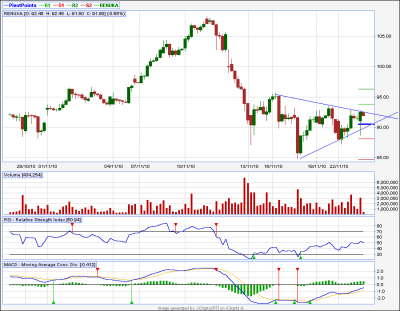
Lookin it from another angle, it gives an impression of sym. triangle, with RSI & MACD in positive zone... With this the target could be as high as 104. Howerver, I always prefer to book the profit in installment....
| Description: |
|
| Filesize: |
18.43 KB |
| Viewed: |
307 Time(s) |
|
|
|
| Back to top |
|
 |
casper
Green Belt

Joined: 02 Oct 2010
Posts: 1315
|
Post: #383  Posted: Tue Nov 23, 2010 10:38 am Post subject: Posted: Tue Nov 23, 2010 10:38 am Post subject: |
 |
|
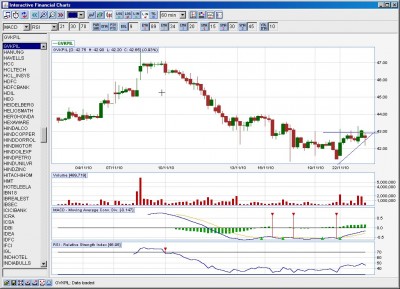
entered gvkpil at 42.60. ascending triangle . macd buy rsi made higer high but a little falling
| Description: |
|
| Filesize: |
168.58 KB |
| Viewed: |
314 Time(s) |
|
|
|
| Back to top |
|
 |
casper
Green Belt

Joined: 02 Oct 2010
Posts: 1315
|
Post: #384  Posted: Tue Nov 23, 2010 10:49 am Post subject: Re: how to trade in intraday Posted: Tue Nov 23, 2010 10:49 am Post subject: Re: how to trade in intraday |
 |
|
| Dutt wrote: | Dear Friends,
Iam new to icharts, and i would require some help and advise , direction to read TA and how to trade in intraday?
Thanks and Regards
Shiv |
today on shout box, pt sir has reffed this website for gathering basic knowledge. www.babypips.com
its about forex but trading ideas and method of viewing charts are same in stock/commodities/ forex. plz check it an click the school tab on that website. u can also find some materials in ichart forum and in this thread also. im writing in hurry as market is on. u plz feel free to ask any thing else if u need
|
|
| Back to top |
|
 |
casper
Green Belt

Joined: 02 Oct 2010
Posts: 1315
|
Post: #385  Posted: Tue Nov 23, 2010 10:56 am Post subject: Re: DRREDDY Posted: Tue Nov 23, 2010 10:56 am Post subject: Re: DRREDDY |
 |
|
| sumesh_sol wrote: | DT... as per Caser strategy MACD/RSI both weak... Shorted now with SL 1774.. Let's see.
-Sumesh |
it seems ultracem started movin a bit now. but dr reddy making me uncomfortable . it made a spike high but still if we arrange the upper tl a lil bit then its still a descending triangle.
i dont like it, but as we entered here we have to wait patiently
renuka is also consolidating on its way
|
|
| Back to top |
|
 |
casper
Green Belt

Joined: 02 Oct 2010
Posts: 1315
|
Post: #386  Posted: Tue Nov 23, 2010 11:09 am Post subject: Re: intraday trade Posted: Tue Nov 23, 2010 11:09 am Post subject: Re: intraday trade |
 |
|
| singh.ravee wrote: | hi casper,
thank you so much for your kind words.
i am basic member of i charts and i have iifl account for intraday charts. I am attaching one of intraday chart of nifty for 22 nov 2010 on 15 min time frame. kindly share your observations and comments
rgds
ravee |
got ur chart and started working on it, but have u real example thread of st sir?
u can find them in forum under the head of srikanth kurdukar.
plz read them , u will get an idea of how to trade using ichart levels, it helped me a lot
|
|
| Back to top |
|
 |
girishhu1
White Belt

Joined: 17 Aug 2009
Posts: 316
|
Post: #387  Posted: Tue Nov 23, 2010 11:41 am Post subject: Posted: Tue Nov 23, 2010 11:41 am Post subject: |
 |
|
hellow casperji,
in case of nelco, what should be the stop loss? it has come below bo level right now.
regards,
girish
|
|
| Back to top |
|
 |
sumesh_sol
Brown Belt

Joined: 06 Jun 2010
Posts: 2344
|
Post: #388  Posted: Tue Nov 23, 2010 11:42 am Post subject: SBIN 60tf Posted: Tue Nov 23, 2010 11:42 am Post subject: SBIN 60tf |
 |
|
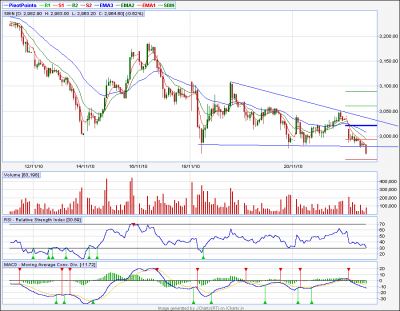
Shorted SBI on BD of DT in 60tf..
Let's see...
-Sumesh
| Description: |
|
| Filesize: |
24.24 KB |
| Viewed: |
315 Time(s) |
|
|
|
| Back to top |
|
 |
casper
Green Belt

Joined: 02 Oct 2010
Posts: 1315
|
Post: #389  Posted: Tue Nov 23, 2010 11:51 am Post subject: Posted: Tue Nov 23, 2010 11:51 am Post subject: |
 |
|
hi ravee.
candle stick method is very basic approach, dont try to depend totally on it during intraday trading. use candle stick patterns on eod chart to determine a trade. let us say that if u see morning star in a stock/index eod chart. verify that with bollinger band to see if there is sufficient upside room or not. remember u r using eod chart now
then during trading, u see the opening and see where it opened of ichart level. now u r using basic chart. believe me s1/s3 and r1/r3 can turn the settle to unsettle very easily. so its better to buy with the support of these levels, u will get a lot of data about in in st sir's thread,
before buying u check 89 ema on 5 min tf. generally it is the hardest barrier at nay given time. try to use it in ur favour. such as ... dont by when its hovering above u and dont sell when its just below ur selling price, always wait for breaching to get good movement.
alternatively u can find ur entry and sl levels if u use the calculator option under the calculator tab on ichart home page. use fibo to find out entry and exit point. plz note here that if u see a gap down with respect to fivo entry point, then for 95% cases u can buy blindly, it will pay off and if its gap up with respect to fivo entry point, just sell it and book at designated fivo entry point, u can use it for any choppy day. it works really good
|
|
| Back to top |
|
 |
casper
Green Belt

Joined: 02 Oct 2010
Posts: 1315
|
Post: #390  Posted: Tue Nov 23, 2010 11:59 am Post subject: Posted: Tue Nov 23, 2010 11:59 am Post subject: |
 |
|
| girish bhaiya 124 by closing in 60 min tf chart for nelco. if it happens then the pattern will be gone and upside potential for time being will be lost
|
|
| Back to top |
|
 |
|

