| View previous topic :: View next topic |
| Author |
a layman's approach to break out and break down |
sumesh_sol
Brown Belt

Joined: 06 Jun 2010
Posts: 2344
|
Post: #391  Posted: Tue Nov 23, 2010 12:32 pm Post subject: Coal india 60tf.. Posted: Tue Nov 23, 2010 12:32 pm Post subject: Coal india 60tf.. |
 |
|
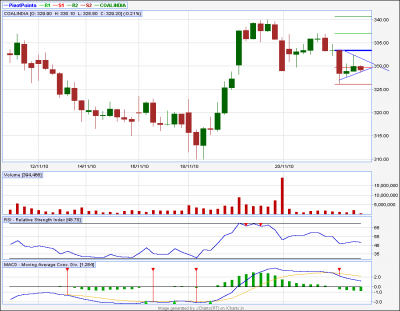
Coal india 60tf..
A Breakdown is most likely.. seeing MACD and RSI..
Will enter only on BD...
-Sumesh
| Description: |
|
| Filesize: |
15.08 KB |
| Viewed: |
330 Time(s) |
|
|
|
| Back to top |
|
 |
|
|
 |
sumesh_sol
Brown Belt

Joined: 06 Jun 2010
Posts: 2344
|
|
| Back to top |
|
 |
sumesh_sol
Brown Belt

Joined: 06 Jun 2010
Posts: 2344
|
Post: #393  Posted: Tue Nov 23, 2010 1:44 pm Post subject: EDUCOMP 60tf Posted: Tue Nov 23, 2010 1:44 pm Post subject: EDUCOMP 60tf |
 |
|
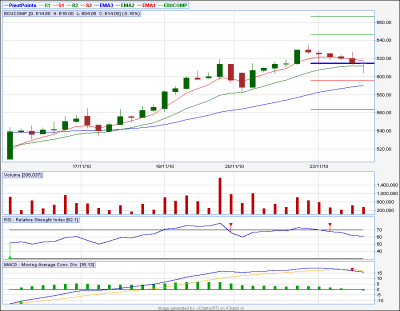
EDUCOMP 60tf:
Shorted on BO in DT. RSI , MACD favours short... Tgt. 598
CIPLA & Coal India booked fully... now only open position is Ultracemco and with this Educomp...
Cheers,
Sumesh
| Description: |
|
| Filesize: |
14.57 KB |
| Viewed: |
291 Time(s) |
|
|
|
| Back to top |
|
 |
sumesh_sol
Brown Belt

Joined: 06 Jun 2010
Posts: 2344
|
Post: #394  Posted: Tue Nov 23, 2010 1:54 pm Post subject: PATNI 60TF.. Posted: Tue Nov 23, 2010 1:54 pm Post subject: PATNI 60TF.. |
 |
|
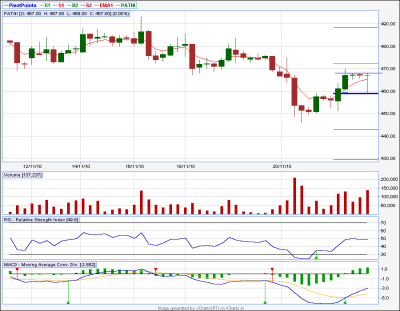
PATNI 60TF..
A BO on upper side is possible.. Will enter on BO
-Sumesh
| Description: |
|
| Filesize: |
15.44 KB |
| Viewed: |
296 Time(s) |
|
|
|
| Back to top |
|
 |
sumesh_sol
Brown Belt

Joined: 06 Jun 2010
Posts: 2344
|
Post: #395  Posted: Tue Nov 23, 2010 3:02 pm Post subject: Final update Posted: Tue Nov 23, 2010 3:02 pm Post subject: Final update |
 |
|
Final update for the day :
Updates on other trades:
1.)Drreddy(Shorted) : Came out with little loss yesterday itself seeing strong trend.
2.) Ultracemco : Booked 50% holding rest for 1140.
3.)Renuka : Did not enter as BO didn't happen
4.)SBIN : Short worked and booked full
5.)Coal india : Short Worked and booked full
6.)CIPLA : Short Worked and booked full
7.)Patni: Long worked and booked full
8.)Educomp : Shorted (but exited at cost , as 3:00 approaching, it was intraday cash short)
Overall satisfactory results.. will test on day after also. Tomorrow no trade for me. On vacation 
Regards,
Sumesh
|
|
| Back to top |
|
 |
sumesh_sol
Brown Belt

Joined: 06 Jun 2010
Posts: 2344
|
Post: #396  Posted: Tue Nov 23, 2010 3:13 pm Post subject: RENUKA .. reverse gear... Posted: Tue Nov 23, 2010 3:13 pm Post subject: RENUKA .. reverse gear... |
 |
|
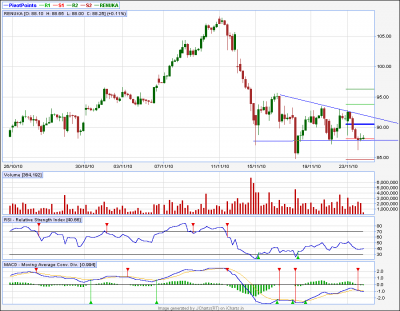
RENUKA..
How market dynamics changes,,, In the mornign we were talking about AT in this counter now look at this , with the time it has given a shape of DT.. I will only consider short if a candle closes after Breakdown...
Regards,
Sumesh
| Description: |
|
| Filesize: |
18.57 KB |
| Viewed: |
316 Time(s) |
|
|
|
| Back to top |
|
 |
measoldier
White Belt

Joined: 09 Sep 2010
Posts: 36
|
Post: #397  Posted: Tue Nov 23, 2010 3:37 pm Post subject: Voltas Posted: Tue Nov 23, 2010 3:37 pm Post subject: Voltas |
 |
|
Today 1st time i took a trade using icharts. Bought voltas futures at 236 and covered at 242.75.
Cheers brothers.
Charts are really saviour of traders:-)
|
|
| Back to top |
|
 |
sinhaalok
White Belt

Joined: 21 Feb 2010
Posts: 15
|
Post: #398  Posted: Tue Nov 23, 2010 4:18 pm Post subject: Re: RENUKA .. reverse gear... Posted: Tue Nov 23, 2010 4:18 pm Post subject: Re: RENUKA .. reverse gear... |
 |
|
sumesh u are a amazing student and practitioner of setups....kudos ....keep going great guns.....  .. ..
| sumesh_sol wrote: | RENUKA..
How market dynamics changes,,, In the mornign we were talking about AT in this counter now look at this , with the time it has given a shape of DT.. I will only consider short if a candle closes after Breakdown...
Regards,
Sumesh |
|
|
| Back to top |
|
 |
singh.ravee
Yellow Belt

Joined: 12 Aug 2010
Posts: 678
|
Post: #399  Posted: Tue Nov 23, 2010 5:34 pm Post subject: Posted: Tue Nov 23, 2010 5:34 pm Post subject: |
 |
|
hello casper,
thank you so much for all your support. reading mr st's thread.
rgds
ravee
|
|
| Back to top |
|
 |
newinvestor
White Belt

Joined: 16 Feb 2010
Posts: 120
|
Post: #400  Posted: Tue Nov 23, 2010 7:00 pm Post subject: Re: Voltas Posted: Tue Nov 23, 2010 7:00 pm Post subject: Re: Voltas |
 |
|
| measoldier wrote: | Today 1st time i took a trade using icharts. Bought voltas futures at 236 and covered at 242.75.
Cheers brothers.
Charts are really saviour of traders:-) |
Can you pls post the chart that you used, for a better understanding
Tks
|
|
| Back to top |
|
 |
casper
Green Belt

Joined: 02 Oct 2010
Posts: 1315
|
Post: #401  Posted: Tue Nov 23, 2010 8:06 pm Post subject: Re: CIPLA 60TF.. Posted: Tue Nov 23, 2010 8:06 pm Post subject: Re: CIPLA 60TF.. |
 |
|
| sumesh_sol wrote: | Entered on BD from sym. triangle seeing -ve RSI & MACD.
Updates on other trades:
1.)Drreddy(Shorted) : Came out with little loss yesterday itself seeing strong trend.
2.) Ultracemco : Still holding .. Doing good even in falling mkt.
3.)Renuka : Did not enter as BO didn't happen
4.)SBIN : Short worked and booked full
5.)Coal india : Short Worked and booked 70%
6.)CIPLA : Holding Short for tgt of 336.8 & 334.1
Putting small amount only. (not more than 20k per trade) for testing .. Over all seems to be working (at least so far), Congrats Casper ! 
Cheers,
Sumesh |
thanks sumesh for ur kind words. but im not to be credited, this set up is primarily derived from st sir's idea of using macd buy/sell signals and breaching a level as entry points. the idea of rsi is derived from saikat sir's famous nvk, if there is a divergence in rsi under certain conditions then price will reverse heavily, that's the basic thing of nvk i guess. here we are using those rsi which has not shown any divergence meaning a sort of failure nvk. that means price is moving in tandem with rsi and and hence we expect a continuation of desired movement.
again, we need to test it in various market conditions and nowadays i am noticing that this set up can not breach weekly pivot levels easily. its an aspect which i never tried to see because i never used these pivot levels in past, nowadays, when we get stuck many a time then i recognized it. i personally use ichart levels and using ichart level plus pivot levels was a complex idea for me and i avoided doing so.
one thing i have learnt from ur postings that though i have tried to see this set up as a signal of possible break outs but in such a cautious market that we presently have, its always very good to wait for a proper bo/bd before making a trade and use this method to verify the validity of the bo/bd after they have already occurred.
another thing i must mention here that i have used it for some sort of smaller patterns where the pattern is formed with fewer candles such as patni. coal india etc among ur postings and have noticed that if the pattern is bigger like sbin or renuka then we have very fewer chance to get a desired bo/bd within intraday trading hours
now these are just observation. i dont know how long this set up will be able to hold itself in various market phases, the more we use it the more it reveals itself to us. let us see
|
|
| Back to top |
|
 |
vishytns
White Belt

Joined: 26 Nov 2009
Posts: 206
|
Post: #402  Posted: Tue Nov 23, 2010 8:15 pm Post subject: Posted: Tue Nov 23, 2010 8:15 pm Post subject: |
 |
|
Sumesh,
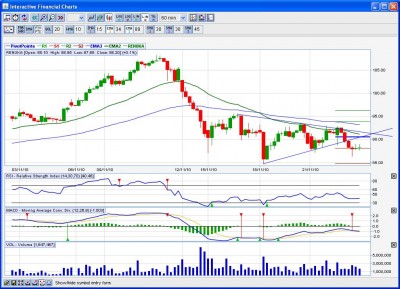
RENUKA, looks like has a symmetrical triangle break down. We will have to look at volumes tmrw. If volumes don't pick up it could enter into consolidation.
Casper,
How is your BSNL line doing buddy? Are u still visiting cyber cafe?
Please provide your views on RENUKA.
Vishy.
| Description: |
|
| Filesize: |
140.52 KB |
| Viewed: |
308 Time(s) |
|
|
|
| Back to top |
|
 |
vishytns
White Belt

Joined: 26 Nov 2009
Posts: 206
|
Post: #403  Posted: Tue Nov 23, 2010 8:28 pm Post subject: Posted: Tue Nov 23, 2010 8:28 pm Post subject: |
 |
|
Casper,
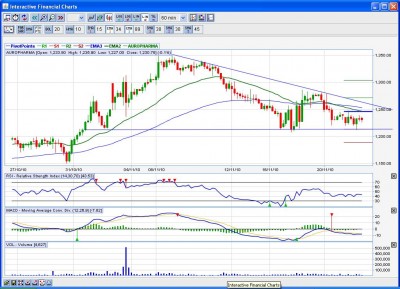
Look at AUROPHARMA, H/S and Descending Triangle formation. We can add this stock to watch list and wait for break down. Provide your inputs.
Vishy
| Description: |
|
| Filesize: |
144.45 KB |
| Viewed: |
299 Time(s) |
|
|
|
| Back to top |
|
 |
measoldier
White Belt

Joined: 09 Sep 2010
Posts: 36
|
|
| Back to top |
|
 |
vishytns
White Belt

Joined: 26 Nov 2009
Posts: 206
|
Post: #405  Posted: Tue Nov 23, 2010 8:41 pm Post subject: Posted: Tue Nov 23, 2010 8:41 pm Post subject: |
 |
|
Casper,
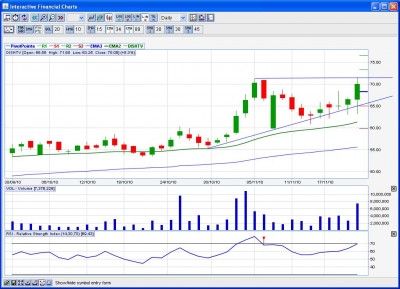
DISHTV, has some interesting pattern. Not sure if it is ascending triangle or Cup part of CUP/Handle formation. I am posting this chart becoz of heavy volumes today in a falling market. Provide your views.
Vishy
| Description: |
|
| Filesize: |
120.61 KB |
| Viewed: |
327 Time(s) |
|
|
|
| Back to top |
|
 |
|

