|
|
| View previous topic :: View next topic |
| Author |
a layman's approach to break out and break down |
vishytns
White Belt

Joined: 26 Nov 2009
Posts: 206
|
Post: #406  Posted: Tue Nov 23, 2010 8:53 pm Post subject: Posted: Tue Nov 23, 2010 8:53 pm Post subject: |
 |
|
Casper,
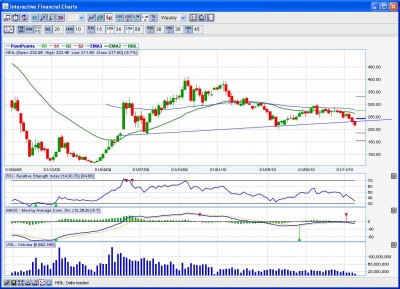
HDIL, H/S in weekly charts. Please provide your views. We need to watch out volumes in comming days. If b/n happens on high volumes this could be a long term impact on the stock.
Vishy
| Description: |
|
| Filesize: |
142.3 KB |
| Viewed: |
252 Time(s) |
|
|
|
| Back to top |
|
 |
|
|  |
vishytns
White Belt

Joined: 26 Nov 2009
Posts: 206
|
Post: #407  Posted: Tue Nov 23, 2010 8:58 pm Post subject: Posted: Tue Nov 23, 2010 8:58 pm Post subject: |
 |
|
Casper,
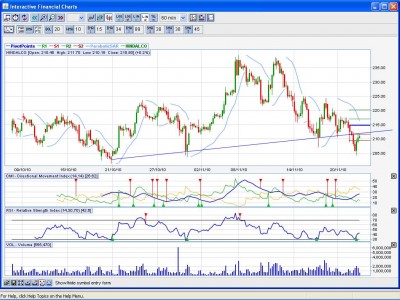
HINDALCO, has formed a H/S, broke down below neck line and also retraced back to neck line. Usually when a head and shoulders forms on a ascending trendline, it is NOT so reliable. Provide your views.
Vishy
| Description: |
|
| Filesize: |
159.05 KB |
| Viewed: |
269 Time(s) |
|
|
|
| Back to top |
|
 |
mrvishal_g
White Belt

Joined: 17 Sep 2010
Posts: 89
|
Post: #408  Posted: Tue Nov 23, 2010 9:26 pm Post subject: Posted: Tue Nov 23, 2010 9:26 pm Post subject: |
 |
|
Hello Casper,
Please comment on
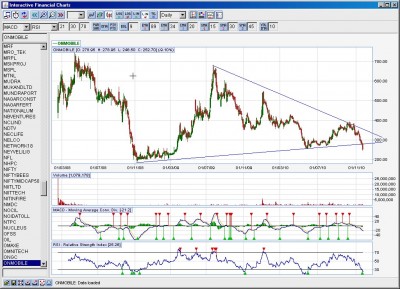
Onmobile 252.7..........RSI is oversold
It is my perception  that tom it will must touch 269 atleast in intraday. that tom it will must touch 269 atleast in intraday.
Vishal
|
|
| Back to top |
|
 |
newinvestor
White Belt

Joined: 16 Feb 2010
Posts: 120
|
Post: #409  Posted: Tue Nov 23, 2010 9:31 pm Post subject: Posted: Tue Nov 23, 2010 9:31 pm Post subject: |
 |
|
| measoldier wrote: | on 30 min tf when rsi bacame oversold and then came out of oversold region i initiated the trade  and changed tf to 5 min when it reached 239 in order to see 3 and 7 ema crossover as a confirmation to exit and changed tf to 5 min when it reached 239 in order to see 3 and 7 ema crossover as a confirmation to exit  but it didnt happen and i booked at 242.75 as last time sumesh and casper had boooked but i had to bear losses by carrying position overnight but it didnt happen and i booked at 242.75 as last time sumesh and casper had boooked but i had to bear losses by carrying position overnight  |
Thanks
|
|
| Back to top |
|
 |
yawalkar
White Belt

Joined: 02 Oct 2010
Posts: 58
|
Post: #410  Posted: Tue Nov 23, 2010 9:31 pm Post subject: Re: New member in ichart Posted: Tue Nov 23, 2010 9:31 pm Post subject: Re: New member in ichart |
 |
|
| casper wrote: | | yawalkar wrote: | Dear Casper,
I am new member of i chart. I want to learn T.A. in detail.
Pls. help me. I have downloaded the e book which you suggest in your previous posts.
I want to know following.
1. You are giving your ideas on various subjects of T.A. can you suggest in a sequence to understand easily.? I mean do you have such a data of your posts in sequence.?
2. You are using various short forms. What is it mean i don't know. Will you help me in this regards.
Pls. guide me..
Thanks in advanace. |
i have not got any teacher in proper sense and followed various websites and senior trader's blog to learn. i have followed the following sequence (unknowingly)
i started with candle stick patterns, in that e book u will see lots of patterns, among them try to learn a few which are marked as dependable
after that i learned bb concept and usage of simple indicators like rsi. macd, stoch etc
then slowly i learned various chart patterns like triangles, double top. head and shoulder etc
this thread is particularly focused on various patterns which are responsible for break out/ break downs, u can find the general descriptions and basic approach to making a target and trading decision from this thread. u plz read the book and try to learn the patterns when u r down, just post me if u want to learn bb and then check this thread u will get the general description of patterns in the mean time if u need any help , just ask me, i will tell u whatever lil bit i know.
i generally use the following short forms
ascending triangle = at
descending triangle=dt
bollinger band=bb
head and shoulder= h/s
symmetrical triangle= sym tri and so on, if u find any thing else in short form just post the term, i will explain |
Dear casper i know little bit about T.A. i want to know how you trade for intraday?
Which graph you use?
which time frame? how you calculate target.
how u use bb?
Can u explain me?
|
|
| Back to top |
|
 |
yawalkar
White Belt

Joined: 02 Oct 2010
Posts: 58
|
Post: #411  Posted: Tue Nov 23, 2010 10:10 pm Post subject: Re: PATNI 60TF.. Posted: Tue Nov 23, 2010 10:10 pm Post subject: Re: PATNI 60TF.. |
 |
|
| sumesh_sol wrote: | PATNI 60TF..
A BO on upper side is possible.. Will enter on BO
-Sumesh |
what is bo?
|
|
| Back to top |
|
 |
vishytns
White Belt

Joined: 26 Nov 2009
Posts: 206
|
Post: #412  Posted: Tue Nov 23, 2010 10:16 pm Post subject: Posted: Tue Nov 23, 2010 10:16 pm Post subject: |
 |
|
yawalkar,
bo - break out
bd - break down
My suggestion is please buy a book on chart reading. Best book
Title : "How to Make money trading with charts". by ashwani gujral. link [LINK REMOVED BY ADMIN]
personally i own this book and is very good for understanding the terminologies.
Vishy
|
|
| Back to top |
|
 |
casper
Green Belt

Joined: 02 Oct 2010
Posts: 1315
|
Post: #413  Posted: Tue Nov 23, 2010 10:43 pm Post subject: Posted: Tue Nov 23, 2010 10:43 pm Post subject: |
 |
|
hi vishy and vishal. 
now bsnl is working but in evening it gave me some tough time.
lets jump to the charts
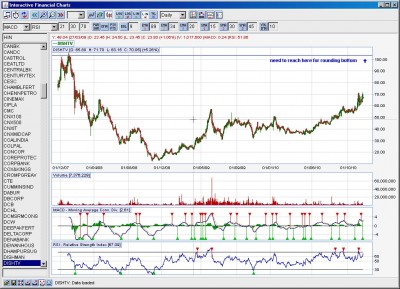
1.renuka= u r right. its sym tri. but as according to our set up, we need to sell with a macd sell mode so i think sumesh did not sold it as sym tri break down, and while we wait for macd sell signal, the pattern turns itself to be a descending triangle
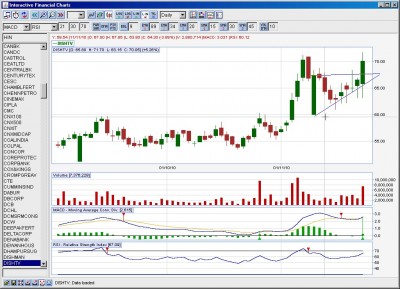
2.dish tv= to confirm it a s cup& handle or rounding bottom. it need to reach 100 level.
the shorter pattern can be considered as a.t.
if u consider this shorter pattern as a handle of a cup, then we will miss the left part of the cup (down treading part) as there is no corresponding high to form the left part at this level
3.hdil= u r right. but the bd candle is the current week candle. so need to see it at the weekend to confirm it.
4.hindalco=macd in sell mode. but histogram reading is going to be bullish. a cross over may takes place in near future. but until it turns to buy mode. i dont think this ascending triangle may be frightful
5.onmobile=it loks like extremely weak. looks like a sym tri break down. vol is also increased plz check the chart. a spike increment amy occur but i think its better to short
| Description: |
|
| Filesize: |
201.49 KB |
| Viewed: |
321 Time(s) |
|
| Description: |
|
| Filesize: |
182.92 KB |
| Viewed: |
275 Time(s) |
|
| Description: |
|
| Filesize: |
209.75 KB |
| Viewed: |
276 Time(s) |
|
|
|
| Back to top |
|
 |
casper
Green Belt

Joined: 02 Oct 2010
Posts: 1315
|
Post: #414  Posted: Tue Nov 23, 2010 10:54 pm Post subject: Re: New member in ichart Posted: Tue Nov 23, 2010 10:54 pm Post subject: Re: New member in ichart |
 |
|
| yawalkar wrote: | | casper wrote: | | yawalkar wrote: | Dear Casper,
I am new member of i chart. I want to learn T.A. in detail.
Pls. help me. I have downloaded the e book which you suggest in your previous posts.
I want to know following.
1. You are giving your ideas on various subjects of T.A. can you suggest in a sequence to understand easily.? I mean do you have such a data of your posts in sequence.?
2. You are using various short forms. What is it mean i don't know. Will you help me in this regards.
Pls. guide me..
Thanks in advanace. |
i have not got any teacher in proper sense and followed various websites and senior trader's blog to learn. i have followed the following sequence (unknowingly)
i started with candle stick patterns, in that e book u will see lots of patterns, among them try to learn a few which are marked as dependable
after that i learned bb concept and usage of simple indicators like rsi. macd, stoch etc
then slowly i learned various chart patterns like triangles, double top. head and shoulder etc
this thread is particularly focused on various patterns which are responsible for break out/ break downs, u can find the general descriptions and basic approach to making a target and trading decision from this thread. u plz read the book and try to learn the patterns when u r down, just post me if u want to learn bb and then check this thread u will get the general description of patterns in the mean time if u need any help , just ask me, i will tell u whatever lil bit i know.
i generally use the following short forms
ascending triangle = at
descending triangle=dt
bollinger band=bb
head and shoulder= h/s
symmetrical triangle= sym tri and so on, if u find any thing else in short form just post the term, i will explain |
Dear casper i know little bit about T.A. i want to know how you trade for intraday?
Which graph you use?
which time frame? how you calculate target.
how u use bb?
Can u explain me? |
hi yawalker,
i use 60 min tf/30 min tf in ichart basic to trade for intraday.
generally i try to trade bo/bd over intraday, for this my general target reamins the minimum estimated target for patterns, such as a base to high distance in case of triangle bo/bd
i use bb for eod only to see possible up/down side with out a break out/break down
normally 3 kinds of trades i take during intraday.
1. triangle/pennant break out break down on intraday chart
2.candle stick patterns (only morning star/evening star). here i use fibo calculator to find out entry/exit/sl levels
3.a very unscientific one, some time(rarely), if i see open =high and chart is not present, i some time sell it with a sl just above the high and same goes gor open= low also. here i buy with a sl just below the low
|
|
| Back to top |
|
 |
casper
Green Belt

Joined: 02 Oct 2010
Posts: 1315
|
Post: #415  Posted: Tue Nov 23, 2010 11:22 pm Post subject: Posted: Tue Nov 23, 2010 11:22 pm Post subject: |
 |
|
| paa wrote: | Thanks Casper,
Please give advice on the following strategy!
1. My objective is for 16 years (retirement).
2. I'll purchase stocks worth rs 10000 every month. And rs 5000 per month to trade nifty F&O.
3. For investment i'll puchase only stocks with mkt cap 10000 crore or more. e.g RIL, LT, SBI, HDFC,Axis, Infosys, Maruti, Bharti airtel, BHEL, Tata power, Sun Pharma, BPCL, ONGC, Bajaj Auto, Educomp.
4. For trading i'll select nifty F&O and stocks trading with decent volumes.
I think this is not right forum to discuss this. Please don't mind!
How to start new threads? |
hi paa, i am really sorry that i am too late to reply. was got very busy suddenly. u can discuss any thing related to market here, though we are more focused on break out /break down tradings. if u want to start a new thread, u can simply click the new topic button under the proper head of the forum.
ur strategy looks good, but i fear u have chosen too many scrips to maintain properly, r u sure u will find enough time to nourish ur investments regularly? its not very easy task for a new comer. i dont want to discourage u, but it may take at least 30 min per day to check the charts of ur holding on a regular basis.
frankly speaking market is too complex thing. u just cant sit quietly while ur hard earned cash is invested, so u need to check. being new, if u face any difficulties then i am sure that the total ichart community will help to to understand. but u have to take the initiative.
and before u start trading try to understand the basic and then plz take paper trades before u start real time trading. because most of us have lost on many occasion and then started earning from the market. so dont try to trade whimsically. a proper strategy and proper money management techniques matters a lot here. so its better to start learning first then earning will follow.
today pt sir has recommended this site for study purpose. its www.babypips.com. its about forex trading, but technical analysis in forex/stock/comm is all the same. plz go through it and click the school tab and start reading from preschool to grad levels , a lot of information is here
|
|
| Back to top |
|
 |
yawalkar
White Belt

Joined: 02 Oct 2010
Posts: 58
|
Post: #416  Posted: Tue Nov 23, 2010 11:28 pm Post subject: Re: New member in ichart Posted: Tue Nov 23, 2010 11:28 pm Post subject: Re: New member in ichart |
 |
|
| casper wrote: | | yawalkar wrote: | | casper wrote: | | yawalkar wrote: | Dear Casper,
I am new member of i chart. I want to learn T.A. in detail.
Pls. help me. I have downloaded the e book which you suggest in your previous posts.
I want to know following.
1. You are giving your ideas on various subjects of T.A. can you suggest in a sequence to understand easily.? I mean do you have such a data of your posts in sequence.?
2. You are using various short forms. What is it mean i don't know. Will you help me in this regards.
Pls. guide me..
Thanks in advanace. |
i have not got any teacher in proper sense and followed various websites and senior trader's blog to learn. i have followed the following sequence (unknowingly)
i started with candle stick patterns, in that e book u will see lots of patterns, among them try to learn a few which are marked as dependable
after that i learned bb concept and usage of simple indicators like rsi. macd, stoch etc
then slowly i learned various chart patterns like triangles, double top. head and shoulder etc
this thread is particularly focused on various patterns which are responsible for break out/ break downs, u can find the general descriptions and basic approach to making a target and trading decision from this thread. u plz read the book and try to learn the patterns when u r down, just post me if u want to learn bb and then check this thread u will get the general description of patterns in the mean time if u need any help , just ask me, i will tell u whatever lil bit i know.
i generally use the following short forms
ascending triangle = at
descending triangle=dt
bollinger band=bb
head and shoulder= h/s
symmetrical triangle= sym tri and so on, if u find any thing else in short form just post the term, i will explain |
Dear casper i know little bit about T.A. i want to know how you trade for intraday?
Which graph you use?
which time frame? how you calculate target.
how u use bb?
Can u explain me? |
hi yawalker,
i use 60 min tf/30 min tf in ichart basic to trade for intraday.
generally i try to trade bo/bd over intraday, for this my general target reamins the minimum estimated target for patterns, such as a base to high distance in case of triangle bo/bd
i use bb for eod only to see possible up/down side with out a break out/break down
normally 3 kinds of trades i take during intraday.
1. triangle/pennant break out break down on intraday chart
2.candle stick patterns (only morning star/evening star). here i use fibo calculator to find out entry/exit/sl levels
3.a very unscientific one, some time(rarely), if i see open =high and chart is not present, i some time sell it with a sl just above the high and same goes gor open= low also. here i buy with a sl just below the low |
Casper,
Can u explain with example with chart.
I can understand esily with chart.
i mean if you show a chart with example for bb, bo/bd, ms/es, how to use fibo calculator to take entry/exit
i am sorry, but i am very eager to know the method.
thanks in advance..
|
|
| Back to top |
|
 |
bassan
White Belt

Joined: 01 Dec 2009
Posts: 57
|
Post: #417  Posted: Tue Nov 23, 2010 11:44 pm Post subject: Nifty correction Posted: Tue Nov 23, 2010 11:44 pm Post subject: Nifty correction |
 |
|
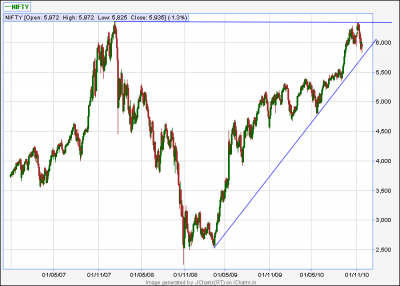
Dear Casper,I post Nifty chart.Sym.triangle is forming.If the TL breaks, what willbe the tgt pls?
| Description: |
|
| Filesize: |
17.64 KB |
| Viewed: |
268 Time(s) |
|
|
|
| Back to top |
|
 |
svgopala
White Belt

Joined: 27 Jun 2009
Posts: 25
|
Post: #418  Posted: Wed Nov 24, 2010 5:53 am Post subject: Posted: Wed Nov 24, 2010 5:53 am Post subject: |
 |
|
| tgt maybe ard 5550
|
|
| Back to top |
|
 |
casper
Green Belt

Joined: 02 Oct 2010
Posts: 1315
|
Post: #419  Posted: Wed Nov 24, 2010 7:47 am Post subject: Posted: Wed Nov 24, 2010 7:47 am Post subject: |
 |
|
yawalker, have u seen it? its about bo/bd trading, i have posted it earlier but i think u could not find it. this doc file may serve as an example of how i trade, i have posted a few examples of bo/bd trading already in the thread. as of past trades, i really have not saved any of my past trades, so right now, i dont have any chart other than is doc. if u wish i can post charts as they appear in future trading
as of ms/es i have no chart at all. but will try to post some of them as they appear in future
i have no clue that so many ppls are reading this thread seriously. so apart from bo/bd posting i only replied questions here. and as no body asked about ms/es i did not post any thing
| Description: |
|

Download |
| Filename: |
An approach to find out true break out.doc |
| Filesize: |
939 KB |
| Downloaded: |
327 Time(s) |
|
|
| Back to top |
|
 |
yawalkar
White Belt

Joined: 02 Oct 2010
Posts: 58
|
Post: #420  Posted: Wed Nov 24, 2010 7:53 am Post subject: Posted: Wed Nov 24, 2010 7:53 am Post subject: |
 |
|
Dear Casper,
A very very big thanks for your help.
i will go thru this file and will come back with my doubts.
100%
bcas i am really egar to understand t.a.
Thanks, once again
|
|
| Back to top |
|
 |
|
|
You cannot post new topics in this forum
You cannot reply to topics in this forum
You cannot edit your posts in this forum
You cannot delete your posts in this forum
You cannot vote in polls in this forum
You can attach files in this forum
You can download files in this forum
|
Powered by phpBB © 2001, 2005 phpBB Group
|
|
|

