| View previous topic :: View next topic |
| Author |
a layman's approach to break out and break down |
casper
Green Belt

Joined: 02 Oct 2010
Posts: 1315
|
Post: #421  Posted: Wed Nov 24, 2010 8:07 am Post subject: Re: Nifty correction Posted: Wed Nov 24, 2010 8:07 am Post subject: Re: Nifty correction |
 |
|
| bassan wrote: | | Dear Casper,I post Nifty chart.Sym.triangle is forming.If the TL breaks, what willbe the tgt pls? |
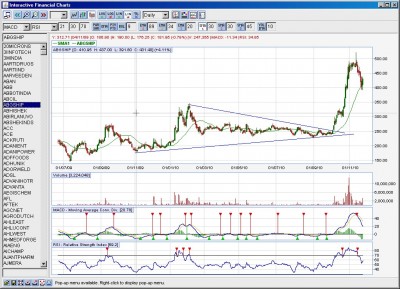
hi bassan, this is not sym tri. in case of sym.tri both of the tl will be converging.
what u posted that looks like an ascending triangle but not proper as the upper tl lacks 2 points. in case of a proper ascending triangle we expect a break out of upper tl. im posting a picture of sym tri here
| Description: |
|
| Filesize: |
202.77 KB |
| Viewed: |
250 Time(s) |
|
|
|
| Back to top |
|
 |
|
|
 |
casper
Green Belt

Joined: 02 Oct 2010
Posts: 1315
|
Post: #422  Posted: Wed Nov 24, 2010 8:10 am Post subject: Posted: Wed Nov 24, 2010 8:10 am Post subject: |
 |
|
| yawalkar wrote: | Dear Casper,
A very very big thanks for your help.
i will go thru this file and will come back with my doubts.
100%
bcas i am really egar to understand t.a.
Thanks, once again |
u r welcome 
|
|
| Back to top |
|
 |
vishytns
White Belt

Joined: 26 Nov 2009
Posts: 206
|
Post: #423  Posted: Wed Nov 24, 2010 8:19 am Post subject: Posted: Wed Nov 24, 2010 8:19 am Post subject: |
 |
|
Casper,
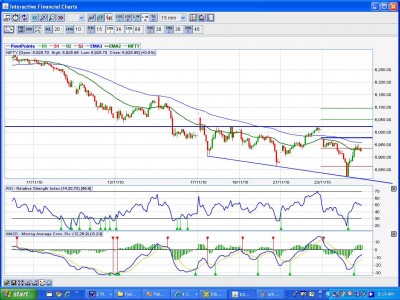
Interesting and rare pattern, Descending-brodening pattern in nifty (15 tf). Provide your views.
Vishy
| Description: |
|
| Filesize: |
150.1 KB |
| Viewed: |
310 Time(s) |
|
|
|
| Back to top |
|
 |
vishytns
White Belt

Joined: 26 Nov 2009
Posts: 206
|
|
| Back to top |
|
 |
casper
Green Belt

Joined: 02 Oct 2010
Posts: 1315
|
Post: #425  Posted: Wed Nov 24, 2010 8:47 am Post subject: Posted: Wed Nov 24, 2010 8:47 am Post subject: |
 |
|
i had no idea of this pattern and had to see the website u mentioned, then when i came to reply i saw u have posted the link here, what a coincident. 
but while posting links make sure that u r not posting any commercial or advertisements, posting should be only about educational purpose. or else it will be against the website rules.
according to bulkowski after breaking the upper tl and sustaining, we can get around 6100.
in case of breaching the lower tl. we can get 5745. but i have not sen this pattern earlier. its so rare . thank u vishy for posting it
|
|
| Back to top |
|
 |
SwingTrader
Site Admin
Joined: 11 Aug 2006
Posts: 2903
Location: Hyderabad, India
|
Post: #426  Posted: Wed Nov 24, 2010 9:27 am Post subject: Posted: Wed Nov 24, 2010 9:27 am Post subject: |
 |
|
I have removed Ashwini Gujral's site link as it is a website that offers paid services, so as per our rules the link is not allowed here. "thepatternsite" link is fine.
NOTE: When posting links just paste the link in the message, do not put the link in quotes. Just paste/type the link url and the message when posted will automatically display it as a link.
_________________
Srikanth Kurdukar
@SwingTrader |
|
| Back to top |
|
 |
anand1234
Yellow Belt

Joined: 17 Jul 2010
Posts: 830
|
Post: #427  Posted: Wed Nov 24, 2010 9:47 am Post subject: Posted: Wed Nov 24, 2010 9:47 am Post subject: |
 |
|
hi.........casper.........
hocl r rock..........but I am holding dwarkesh @114 & hcc @66.............shd I hold??..........or shift to another scrip??........pls ..........guide me........
thanks
anand
|
|
| Back to top |
|
 |
measoldier
White Belt

Joined: 09 Sep 2010
Posts: 36
|
Post: #428  Posted: Wed Nov 24, 2010 9:58 am Post subject: Help Posted: Wed Nov 24, 2010 9:58 am Post subject: Help |
 |
|
| Anyone pls let me know in icharts how to increase number of days in data to be displayed. By default it is 3 days in all time frames other than daily, weekly and monthly.
|
|
| Back to top |
|
 |
sumesh_sol
Brown Belt

Joined: 06 Jun 2010
Posts: 2344
|
Post: #429  Posted: Wed Nov 24, 2010 10:04 am Post subject: BHARATFORG 60TF Posted: Wed Nov 24, 2010 10:04 am Post subject: BHARATFORG 60TF |
 |
|
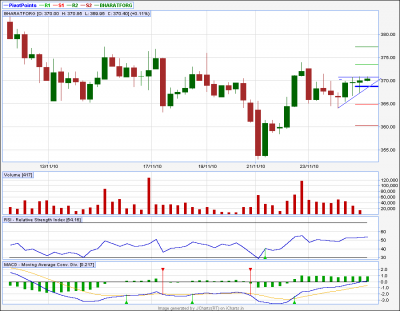
BHARATFORG 60TF..
A Breakout on upper side possible... tgt could be 375..
-Sumesh
| Description: |
|
| Filesize: |
15.37 KB |
| Viewed: |
285 Time(s) |
|
|
|
| Back to top |
|
 |
sumesh_sol
Brown Belt

Joined: 06 Jun 2010
Posts: 2344
|
Post: #430  Posted: Wed Nov 24, 2010 10:32 am Post subject: Polaris 60 tf Posted: Wed Nov 24, 2010 10:32 am Post subject: Polaris 60 tf |
 |
|
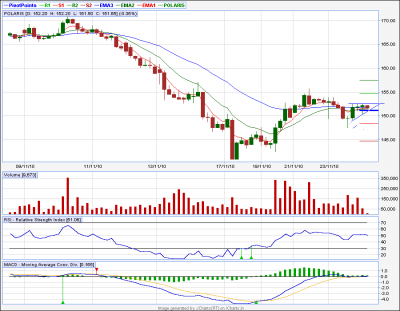
Polaris
Upper BO is possible ...
tgt may be 375 .. enter on BO...
-Sumesh
| Description: |
|
| Filesize: |
19 KB |
| Viewed: |
286 Time(s) |
|
|
|
| Back to top |
|
 |
casper
Green Belt

Joined: 02 Oct 2010
Posts: 1315
|
Post: #431  Posted: Wed Nov 24, 2010 11:32 am Post subject: Posted: Wed Nov 24, 2010 11:32 am Post subject: |
 |
|
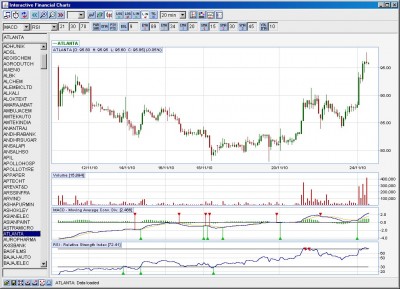
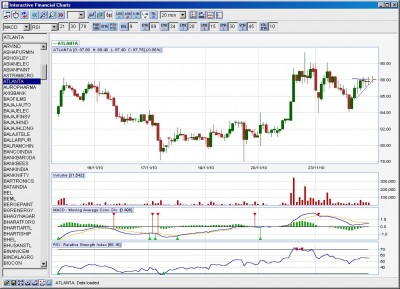
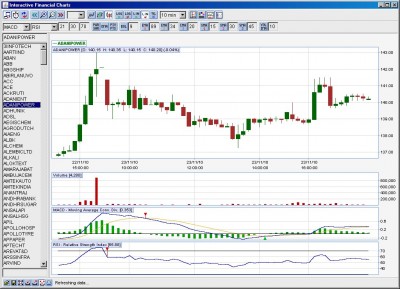
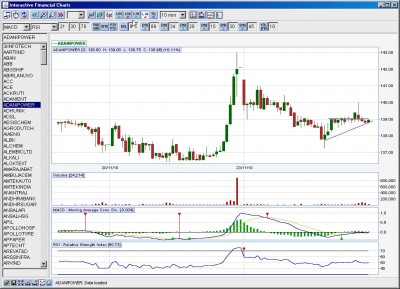
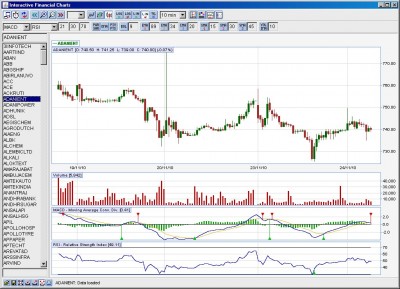
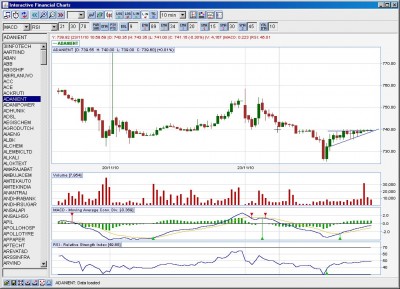
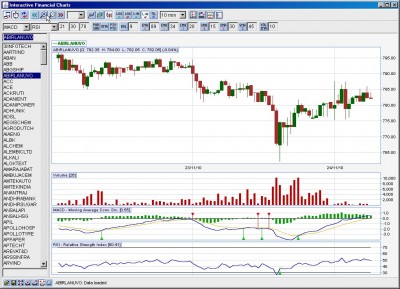
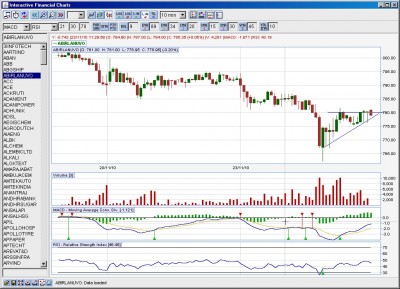
a few trades and results. using shorter tf. (dont know will both of the koreans continue fight today or some body will make a scam. yesterday market crashed only to crash my gvkpil trade. so tried to play like virendra sehwag.)
each of the trades has two parts. entry set up and result chart
| Description: |
|
| Filesize: |
176.74 KB |
| Viewed: |
254 Time(s) |
|
| Description: |
|
| Filesize: |
179.64 KB |
| Viewed: |
236 Time(s) |
|
| Description: |
|
| Filesize: |
171.63 KB |
| Viewed: |
265 Time(s) |
|
| Description: |
|
| Filesize: |
169.78 KB |
| Viewed: |
241 Time(s) |
|
| Description: |
|
| Filesize: |
180.55 KB |
| Viewed: |
265 Time(s) |
|
| Description: |
|
| Filesize: |
182.22 KB |
| Viewed: |
246 Time(s) |
|
| Description: |
|
| Filesize: |
179.75 KB |
| Viewed: |
280 Time(s) |
|
| Description: |
|
| Filesize: |
191.99 KB |
| Viewed: |
242 Time(s) |
|
|
|
| Back to top |
|
 |
casper
Green Belt

Joined: 02 Oct 2010
Posts: 1315
|
Post: #432  Posted: Wed Nov 24, 2010 11:41 am Post subject: Posted: Wed Nov 24, 2010 11:41 am Post subject: |
 |
|
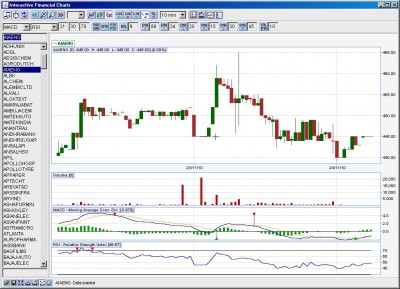
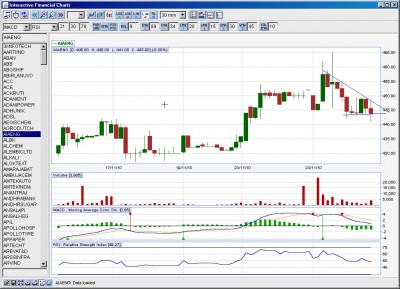
all is not well!
expected more downfall here
| Description: |
|
| Filesize: |
166.99 KB |
| Viewed: |
261 Time(s) |
|
| Description: |
|
| Filesize: |
172.65 KB |
| Viewed: |
287 Time(s) |
|
|
|
| Back to top |
|
 |
casper
Green Belt

Joined: 02 Oct 2010
Posts: 1315
|
Post: #433  Posted: Wed Nov 24, 2010 11:56 am Post subject: Posted: Wed Nov 24, 2010 11:56 am Post subject: |
 |
|
| anand1234 wrote: | hi.........casper.........
hocl r rock..........but I am holding dwarkesh @114 & hcc @66.............shd I hold??..........or shift to another scrip??........pls ..........guide me........
thanks
anand |
dwarkesh has crossed some important resistance today, if it closes at or above 105, then we can expect 118-120 within a couple of days
hcc has broken some of the important support levels and now hovering above the lower bollinger band, and formed a descending triangle here, if it breaks down from here (56 level) then can reach 52 very fast.
it has resistance around 60-62 range and only above this level we can expect 66
|
|
| Back to top |
|
 |
casper
Green Belt

Joined: 02 Oct 2010
Posts: 1315
|
Post: #434  Posted: Wed Nov 24, 2010 12:03 pm Post subject: Re: Help Posted: Wed Nov 24, 2010 12:03 pm Post subject: Re: Help |
 |
|
| measoldier wrote: | | Anyone pls let me know in icharts how to increase number of days in data to be displayed. By default it is 3 days in all time frames other than daily, weekly and monthly. |
u see the time frame drop down menu?? now just click on the button which is just immediately left to this drop down menu, it will allow u to adjust number of days and number of years.
whatever days u select at most u can get around 10-20 days depending upon ur system and network connection, so selecting more than 20 days wont be helpful
|
|
| Back to top |
|
 |
sumesh_sol
Brown Belt

Joined: 06 Jun 2010
Posts: 2344
|
Post: #435  Posted: Wed Nov 24, 2010 12:12 pm Post subject: RELCAPITAL 60tf... Posted: Wed Nov 24, 2010 12:12 pm Post subject: RELCAPITAL 60tf... |
 |
|
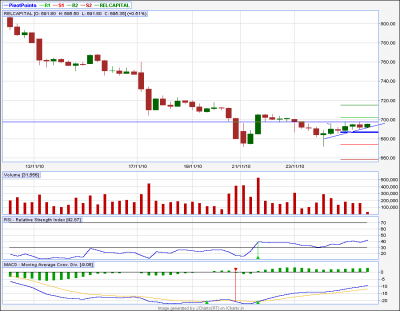
RELCAPITAL 60tf...
Upper BO possible..However, as it is near R1, I will go long above 702.5 for a tgt of 714..
BHARATFORG hit the target... Polaris yet not BO so waiting...
-Sumesh
| Description: |
|
| Filesize: |
13.97 KB |
| Viewed: |
248 Time(s) |
|
|
|
| Back to top |
|
 |
|

