|
|
| View previous topic :: View next topic |
| Author |
a layman's approach to break out and break down |
newinvestor
White Belt

Joined: 16 Feb 2010
Posts: 120
|
Post: #46  Posted: Thu Oct 28, 2010 12:09 pm Post subject: Posted: Thu Oct 28, 2010 12:09 pm Post subject: |
 |
|
| Thanks for the detailed reply, Casper. will study in depth
|
|
| Back to top |
|
 |
|
|  |
casper
Green Belt

Joined: 02 Oct 2010
Posts: 1315
|
Post: #47  Posted: Thu Oct 28, 2010 12:49 pm Post subject: Posted: Thu Oct 28, 2010 12:49 pm Post subject: |
 |
|
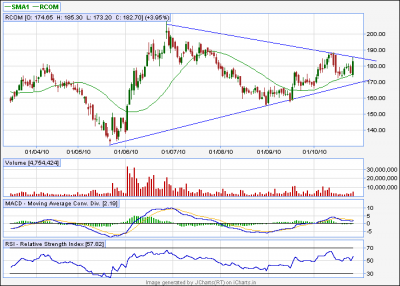
girishhu1: here im posting the rcom chart, what u posted is also a bo set up, but with out breaking out the pattern im posting, it wont be effective,
whenever u find some long term pattern going to break out, just try to find it in smaller tf to find what could be the primary target
in ur posted chart, the target will be atleast 100 from the bo, but it has to clear the target i already mentioned, if it fails to clear those resistance levels, then the bigger pattern will also fail
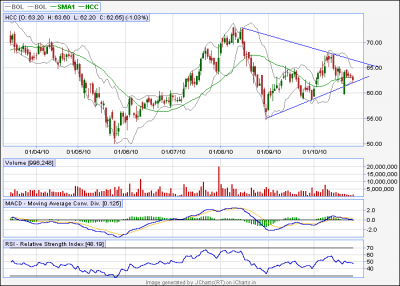
mrvishal-g: here is ur chart, look the tl +lower bb for a strong support, here volume declined indicating a consolidation, in case of break out (above upper tl) or break down (lower tl) i hope vol will be back with added momentum.
since both the chart is of symmetrical triangle category(its a neutral pattern where the next move's direction will depend on the bo/bd) its always advisable to avoid these patterns until break out or break down takes place,
as of myself, im tushar, 26yrs old, a humble zoology grad, basically exporter of handicrafts items,who was heavily hurt by credit crunch during 2008-2009, and had no option but to "gamble" in the stock market with no knowledge, and obviously got hurt more here,
i hv no formal education of technical analysis of stock market (because i simply could not afford when i need it most)
all i learnt is from mainly blogs of ichart and other websites and (as i had no option to consult any body) experimented it during my lil bit trading
i found them useful enough and decided to share with my brothers/sisters who ,although want to learn but could not do so due to various reasons.
these theories of bo/bd has changed me a lot,i returned to the path of success after a prolonged "consolidation", so im here to play the role of "CASPER-- THE FRIENDLY GHOST" for those who need 
MAY THE ALMIGHTY BLESS ALL OF U AND MAY U PROSPER BY LEAPS AND BOUNDS IN THE INTERESTING WORLD OF STOCK TRADING

| Description: |
|
| Filesize: |
28.48 KB |
| Viewed: |
621 Time(s) |
|
| Description: |
|
| Filesize: |
25.73 KB |
| Viewed: |
584 Time(s) |
|
|
|
| Back to top |
|
 |
newinvestor
White Belt

Joined: 16 Feb 2010
Posts: 120
|
Post: #48  Posted: Thu Oct 28, 2010 1:34 pm Post subject: Posted: Thu Oct 28, 2010 1:34 pm Post subject: |
 |
|
Casper, the Friendly Ghost. It was interseting to read about your background.
I am sure many have a similiar story, long period of "consolidation"and maybe losses, now looking for a trading startegy to understand and implement.
I have been trading and losing for long, now looking for a stable trading pattern.
I understand your point about the cup and handle and Rounded bottom being long term patters, and will trade accordingly.
From a short term trade point of view, what have you found succesful
best regards
|
|
| Back to top |
|
 |
casper
Green Belt

Joined: 02 Oct 2010
Posts: 1315
|
Post: #49  Posted: Thu Oct 28, 2010 2:58 pm Post subject: Posted: Thu Oct 28, 2010 2:58 pm Post subject: |
 |
|
hi newinvestor,
sorry, was closing my trades, so got late 2 reply.
before we go in depth with trading set ups, can u plz furnish me some informations abt ur trading styles? it will help me to understand ur criteria clearly.
my questions are
1.do u day trade?
2. do u subscribe this web site?(coz, i chart provides "ichart levels" just like pivot or fibo level, but much more useful, i personally trade with them so my trading set up will involve them heavily)
3. most imp, how long can u hold a stock in terms of "short term"?
4. and last, how much do u expect from a day trade and from a short term trade?
plz reply me, so that i can make an estimate of how to trade
|
|
| Back to top |
|
 |
newinvestor
White Belt

Joined: 16 Feb 2010
Posts: 120
|
Post: #50  Posted: Thu Oct 28, 2010 3:46 pm Post subject: Posted: Thu Oct 28, 2010 3:46 pm Post subject: |
 |
|
| casper wrote: |
Hi Casper ,
Pls note my reply in italics.
hi newinvestor,
sorry, was closing my trades, so got late 2 reply.
before we go in depth with trading set ups, can u plz furnish me some informations abt ur trading styles? it will help me to understand ur criteria clearly.
my questions are
1.do u day trade? // Not usually. At times on upmoving stocks like UFLEX, I buy if it goes above the previous day's high and square off the same day.
I am more interetsed in a short term or positional trade.
2. do u subscribe this web site?(coz, i chart provides "ichart levels" just like pivot or fibo level, but much more useful, i personally trade with them so my trading set up will involve them heavily). [i]No, I have not subscribed. Which plan is best ?[/i]
3. most imp, how long can u hold a stock in terms of "short term"? // I was thinking of a period of around 2 weeks. However, would like your thoughts on what is the best period.
4. and last, how much do u expect from a day trade and from a short term trade? // I think a couple of % in day trade and around 10- 15 % on the short term trades.
plz reply me, so that i can make an estimate of how to trade |
|
|
| Back to top |
|
 |
casper
Green Belt

Joined: 02 Oct 2010
Posts: 1315
|
Post: #51  Posted: Thu Oct 28, 2010 3:54 pm Post subject: Posted: Thu Oct 28, 2010 3:54 pm Post subject: |
 |
|
ok got it, now im going for my launch, will be back wid ur set up around 5pm, till then ,bye

|
|
| Back to top |
|
 |
mrvishal_g
White Belt

Joined: 17 Sep 2010
Posts: 89
|
Post: #52  Posted: Thu Oct 28, 2010 5:28 pm Post subject: Posted: Thu Oct 28, 2010 5:28 pm Post subject: |
 |
|
Thanks for reply
Your story is quiet interesting.
Please tell the working system of Ichart software.
Presently, i am taking eod data from equal solution which is ultimately used in advance get and metastock software.
Charges is 2500/- year
|
|
| Back to top |
|
 |
casper
Green Belt

Joined: 02 Oct 2010
Posts: 1315
|
Post: #53  Posted: Thu Oct 28, 2010 6:27 pm Post subject: Posted: Thu Oct 28, 2010 6:27 pm Post subject: |
 |
|
hi newinvestor,
in my view, a btst like approach in break out trades will give you satisfactory results,
along with normal trading rules, u may find some tricks are very useful. im going to describe what i do, i hope it will be useful to u also.
1. my favorite patterns are ascending triangle, pennant and symmetrical triangle. because of their dependable break out and speedy target appreciation.
2. i use the PRICE/VOL EXPANSION link under the head of STOCKLIST of the icharts options(among left hand side tabs) to start. it takes around 6.45-7.00 pm to be updated. i use this chart to look for possible bo candidates. this is my 1st step.
3.in this option, u will see lots of scrips are mentioned, i have to go through them one by one
4. now my task is to open the chart in jchart eod and draw treandlines to SATISFY myself that there is a valid reason for break out.
5. this is the most imp step.
6.there will be 30-50 scrips listed here, among them i need to get around 5 stocks,coz i will trade in one or two per day, so per day 5 recommendation is more than enough for me
6. during this step, i need to make sure that the pattern which has shown price and vol expansion is a perfect ascending triangle, or symmetrical triangle or pennant whatever the category may be, but i repeat the pattern should be classic and robust
7.now comes the target projection, i just measure the perpendicular distance of the highest high from the lower tl and project it from the break out point,
8. now the final step,I DRAW PARALLEL LINES ON THE EVERY PREVIOUS HIGH TO MAKE SURE THAT NONE OF THESE STRONGEST RESISTANCE IS GOING TO OBSTACLE ME DURING MY TRADE, IF THERE IS ANY TL WHICH IS RELATIVELY CLOSER TO ME THEN I WILL SIMPLY AVOID THE SCRIP,
9.now i am almost done, i will shut down my pc or start watching cartoon on you tube  but two TRICKS are left yet. but two TRICKS are left yet.
10. in the morning i would verify if the broker is going to finance me for longs(means buy calls) for a period of 5 days(one trading week)
in general almost all private broker do finance on their client's long position up to 3 or 4 times of their margin money, this is very useful during btst/short term trading,because it will turn my 5% humble profit(which is quite common as i hv found in case of breakout)into 15-20% profit 
now the final trick.............
i dont jump in the market with the morning bell,
i will wait atleast 5-10 minutes before taking my 1st trade, after this time i will find which of those 5 recommendations i have made,has open=low,(it may seem ridiculous but i generally get atleast 1 stock which shows it)
and if the stock is available in the real time chart service of i chart then nothing to say, that chart will show me if i am buying at a support level or not, i will buy it around the support and then take an sl a few rupees below the low or the support level near which i bought, and place a target and my task is over 
JUST TO MENTION A FEW POINTS
1.u asked me what service is good, in my experience, premium service is best, but if u want to trade only in stocks and no future and options, then the basic subscription will also do the job
2.before u take trades in this fashion, u plz take some paper trades for 1/2 weeks, it will show u the strength and weakness of this set up. then only after u have confidence u do it in real
just feel free if u want to ask anything else 
|
|
| Back to top |
|
 |
casper
Green Belt

Joined: 02 Oct 2010
Posts: 1315
|
Post: #54  Posted: Thu Oct 28, 2010 6:41 pm Post subject: Posted: Thu Oct 28, 2010 6:41 pm Post subject: |
 |
|
| mrvishal_g wrote: | Thanks for reply
Your story is quiet interesting.
Please tell the working system of Ichart software.
Presently, i am taking eod data from equal solution which is ultimately used in advance get and metastock software.
Charges is 2500/- year |
here we get eod data for free!!!!!,
if u just want to check the chart, u plz click on charts(premium) link it will show u the chart, but wont let u to do any thing on it.
if u want to study charts with trend lines, firbo levels and so on, just click the jchart eod link, this will lead u to our charting tool
here u will get all the scrip codes, along with all the most used indicators and drawing tool, just right click on the chart and u have a vast array of drawing/editing tools at ur finger tip!!
its really fun to use the jchart eod, just try it and if u have any prb just ask me, i will tell u whatever i know 
|
|
| Back to top |
|
 |
newinvestor
White Belt

Joined: 16 Feb 2010
Posts: 120
|
Post: #55  Posted: Thu Oct 28, 2010 11:06 pm Post subject: Posted: Thu Oct 28, 2010 11:06 pm Post subject: |
 |
|
now the final trick.............
i dont jump in the market with the morning bell,
i will wait atleast 5-10 minutes before taking my 1st trade, after this time i will find which of those 5 recommendations i have made,has open=low,(it may seem ridiculous but i generally get atleast 1 stock which shows it)
When you say open = low, what do you mean?
Also, do you go thru the charts for ll the stocks in the volume expansion list? Too many are there !!
Regards
|
|
| Back to top |
|
 |
casper
Green Belt

Joined: 02 Oct 2010
Posts: 1315
|
Post: #56  Posted: Thu Oct 28, 2010 11:55 pm Post subject: Posted: Thu Oct 28, 2010 11:55 pm Post subject: |
 |
|
after 5 or 10 minutes of trading, a stock has the opening price as same as low price, means the stock has not declined yet, as during the opening there is higher volatility, but still the stock has not declined, so at times it shows that the opening price is a support price,
that means we have a support just behind us when we enter the trade,
and now, as we are trading a bo, so the chance is with this open=low support the stock will zoom,
in other words, when open =low, that means the price is making higher high, so its a clear uptreand 
same,in case of break down, if u see after 10 minutes of opening trade (high volatility in opening) the open= high, that means the price is making lower lows..... clearly in down trend
in short, this method will show u if ur expected trend is on or not, if ur trend is on then u just go with it
and yes i have already gone thru the chart and have made my watch list also,
im writing here, u dont trade, just watch out tomorrow,
in morning i will try to post the charts and will explain why i have chosen them,
MY RECOMMENDATION FOR MY TOMORROW'S TRADE IS
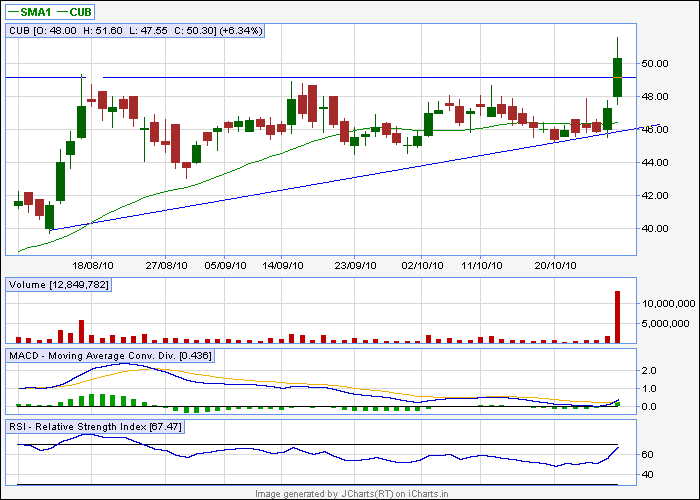
1.cub, btst target 60,cmp 50.30
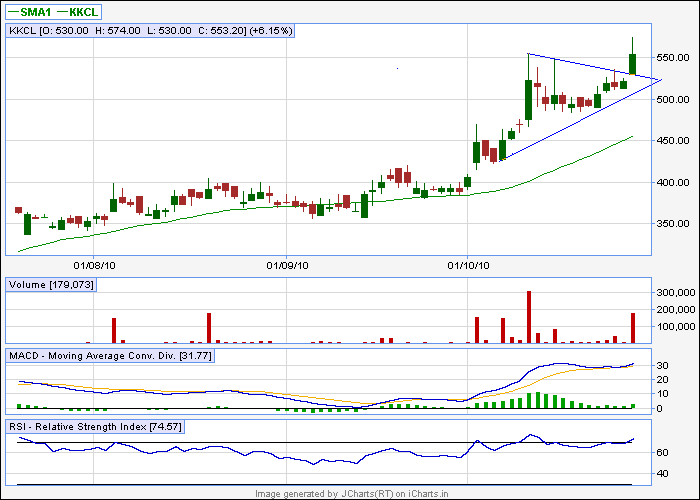
2.kkcl. target 635,cmp 553
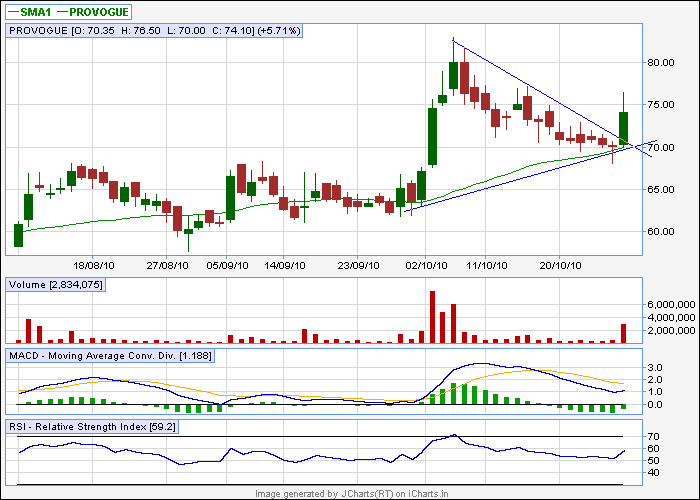
3.provogue. target 83,cmp 74
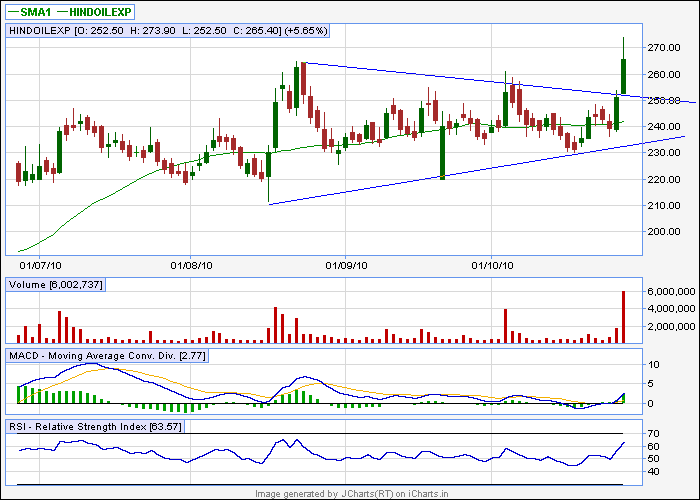
4.hindoilexp. target 290, cmp265
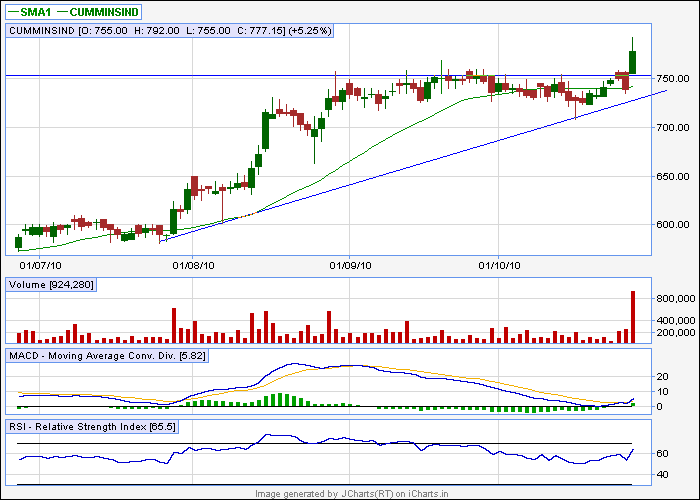
5.cumminsind. target 850 cmp 750,
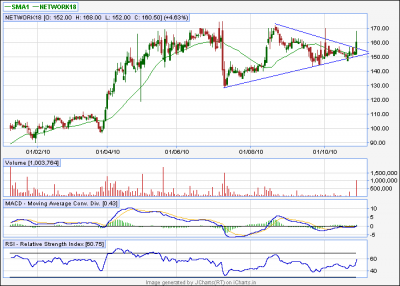
6.network18 target 185, cmp 160
though as i hv said, i dont know now among all these which one im going to trade, that will be decided during market hour,
as i hv repeatedly mentioned that im a day trader, so i follow open=low strictly upto the decimals also
in ur case, as u will trade positionally so u can just ignore the decimals, but as a day trader, i hv 2 follow it more strictly as i hv 2 close within 3 pm
|
|
| Back to top |
|
 |
newinvestor
White Belt

Joined: 16 Feb 2010
Posts: 120
|
Post: #57  Posted: Fri Oct 29, 2010 12:38 am Post subject: Posted: Fri Oct 29, 2010 12:38 am Post subject: |
 |
|
| Tks
|
|
| Back to top |
|
 |
newinvestor
White Belt

Joined: 16 Feb 2010
Posts: 120
|
Post: #58  Posted: Fri Oct 29, 2010 12:45 am Post subject: Posted: Fri Oct 29, 2010 12:45 am Post subject: |
 |
|
| In the stocklist, Indian Bk and Rane Holding seem to be a descending triangle, and then an upward break?
|
|
| Back to top |
|
 |
casper
Green Belt

Joined: 02 Oct 2010
Posts: 1315
|
Post: #59  Posted: Fri Oct 29, 2010 8:43 am Post subject: Posted: Fri Oct 29, 2010 8:43 am Post subject: |
 |
|
yes, u will find this kind of activities on the price/vol expansion segment too often. here the stock was supposed to go down. but its going up. a number of reasons may be behind this.
may be due a good result or some good deals which may have changed the fundamental, or may be simply due to operator like activity.
GOD BLESS THESE STOCKS AND MAY THEY ZOOM A 1000 TIMES OF CMP, BUT I AM NOT GOING TO INVEST AS THE REASON OF THEIR BREAK OUT IS NOT CLEAR TO ME.yes i may be wrong and my sl may be hit,as no system is full proof. but still this system has paid off. and if there is a fault, then i may fix it.because i understand this kinds of setting. thats my idea.
i am very strict here, these stocks may be gold mines, but its not my cup of tea. i will go for the stocks whose pattern i do understand.
im attaching the charts of the stocks, where i feel the break out is "viable" and i understood the reason. plz check them
1.cub, btst target 60,cmp 50.30
2.kkcl. target 635,cmp 553
3.provogue. target 83,cmp 74
4.hindoilexp. target 290, cmp265
5.cumminsind. target 850 cmp 750,
6.network18 target 185, cmp 160
| Description: |
|
| Filesize: |
11.26 KB |
| Viewed: |
2541 Time(s) |
|
| Description: |
|
| Filesize: |
9.6 KB |
| Viewed: |
2541 Time(s) |
|
| Description: |
|
| Filesize: |
11.62 KB |
| Viewed: |
2541 Time(s) |
|
| Description: |
|
| Filesize: |
11.42 KB |
| Viewed: |
2541 Time(s) |
|
| Description: |
|
| Filesize: |
10.66 KB |
| Viewed: |
2541 Time(s) |
|
| Description: |
|
| Filesize: |
14.18 KB |
| Viewed: |
552 Time(s) |
|
|
|
| Back to top |
|
 |
casper
Green Belt

Joined: 02 Oct 2010
Posts: 1315
|
Post: #60  Posted: Fri Oct 29, 2010 9:46 am Post subject: Posted: Fri Oct 29, 2010 9:46 am Post subject: |
 |
|
just to update!!!
MARKET HAS A BEARISH TONE, but provogue, cub and kkcl has open=low,
i hv bought cub@51.50, because i just like the ascend.trngle. 
made a high of 52.20, now 52.15
|
|
| Back to top |
|
 |
|
|
You cannot post new topics in this forum
You cannot reply to topics in this forum
You cannot edit your posts in this forum
You cannot delete your posts in this forum
You cannot vote in polls in this forum
You can attach files in this forum
You can download files in this forum
|
Powered by phpBB © 2001, 2005 phpBB Group
|
|
|

