| View previous topic :: View next topic |
| Author |
a layman's approach to break out and break down |
ravionlinek
White Belt

Joined: 11 Jun 2010
Posts: 97
|
Post: #466  Posted: Thu Nov 25, 2010 10:20 am Post subject: Posted: Thu Nov 25, 2010 10:20 am Post subject: |
 |
|
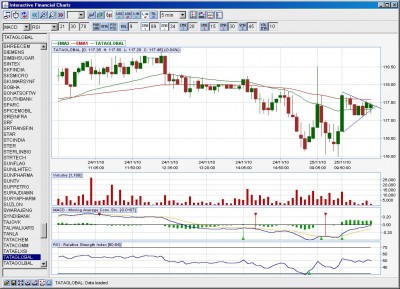
chek out Tata global
is there break out on 5 min chart
|
|
| Back to top |
|
 |
|
|
 |
casper
Green Belt

Joined: 02 Oct 2010
Posts: 1315
|
Post: #467  Posted: Thu Nov 25, 2010 10:26 am Post subject: Posted: Thu Nov 25, 2010 10:26 am Post subject: |
 |
|
not broken out yet, break out is likely as per macd signal. buy if goes above 117. be careful as 118 is ichart r1. one of the strongest level to breach
| Description: |
|
| Filesize: |
197.45 KB |
| Viewed: |
262 Time(s) |
|
|
|
| Back to top |
|
 |
ravionlinek
White Belt

Joined: 11 Jun 2010
Posts: 97
|
Post: #468  Posted: Thu Nov 25, 2010 10:29 am Post subject: Posted: Thu Nov 25, 2010 10:29 am Post subject: |
 |
|
thanx ...........
casper
|
|
| Back to top |
|
 |
casper
Green Belt

Joined: 02 Oct 2010
Posts: 1315
|
Post: #469  Posted: Thu Nov 25, 2010 10:30 am Post subject: Posted: Thu Nov 25, 2010 10:30 am Post subject: |
 |
|
| newinvestor, ravionlinek thanks and welcome
|
|
| Back to top |
|
 |
casper
Green Belt

Joined: 02 Oct 2010
Posts: 1315
|
Post: #470  Posted: Thu Nov 25, 2010 10:49 am Post subject: Posted: Thu Nov 25, 2010 10:49 am Post subject: |
 |
|
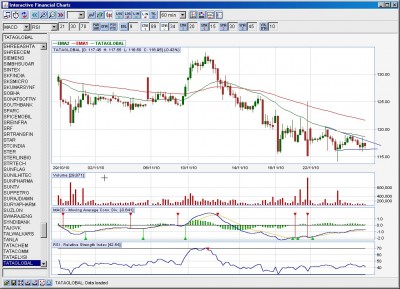
tata global. descending triangle in 60 min tf. macd still in buy mode, but going to make a bearish cross over and would turn in sell mode. can be shorted if a bd happens from 115 level with a target of 110
| Description: |
|
| Filesize: |
190.7 KB |
| Viewed: |
258 Time(s) |
|
|
|
| Back to top |
|
 |
sumesh_sol
Brown Belt

Joined: 06 Jun 2010
Posts: 2344
|
|
| Back to top |
|
 |
casper
Green Belt

Joined: 02 Oct 2010
Posts: 1315
|
Post: #472  Posted: Thu Nov 25, 2010 11:17 am Post subject: Posted: Thu Nov 25, 2010 11:17 am Post subject: |
 |
|
| sumesh 1720 is monthly pivot. will be hard to break it. once broken we can expect good upmove. and 1730 ichart r1
|
|
| Back to top |
|
 |
sumesh_sol
Brown Belt

Joined: 06 Jun 2010
Posts: 2344
|
Post: #473  Posted: Thu Nov 25, 2010 11:37 am Post subject: HINDALCO Posted: Thu Nov 25, 2010 11:37 am Post subject: HINDALCO |
 |
|
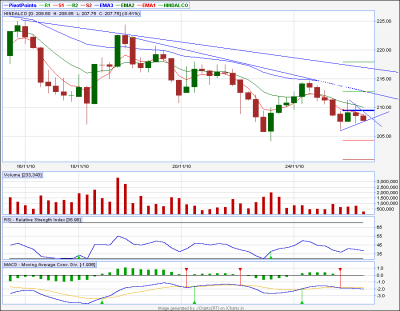
HINDALCO..
Can break down intra for a target of 204 & 202..
Will enter on BD
-Sumesh
| Description: |
|
| Filesize: |
17.67 KB |
| Viewed: |
253 Time(s) |
|
|
|
| Back to top |
|
 |
yawalkar
White Belt

Joined: 02 Oct 2010
Posts: 58
|
Post: #474  Posted: Thu Nov 25, 2010 12:08 pm Post subject: NVK today Posted: Thu Nov 25, 2010 12:08 pm Post subject: NVK today |
 |
|
casper,
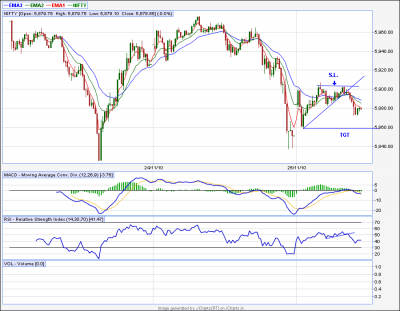
is this a NVK pattern today?
| Description: |
|
| Filesize: |
43.28 KB |
| Viewed: |
258 Time(s) |
|
|
|
| Back to top |
|
 |
maooliservice
White Belt

Joined: 04 Aug 2010
Posts: 93
|
Post: #475  Posted: Thu Nov 25, 2010 1:10 pm Post subject: Posted: Thu Nov 25, 2010 1:10 pm Post subject: |
 |
|
dear casper(junior),
below quotes r from ur one article.
alternatively u can find ur entry and sl levels if u use the calculator option under the calculator tab on ichart home page. use fibo to find out entry and exit point. plz note here that if u see a gap down with respect to fivo entry point, then for 95% cases u can buy blindly, it will pay off and if its gap up with respect to fivo entry point, just sell it and book at designated fivo entry point, u can use it for any choppy day. it works really good
can u explain this with the help of chart
|
|
| Back to top |
|
 |
casper
Green Belt

Joined: 02 Oct 2010
Posts: 1315
|
Post: #476  Posted: Thu Nov 25, 2010 1:19 pm Post subject: Posted: Thu Nov 25, 2010 1:19 pm Post subject: |
 |
|
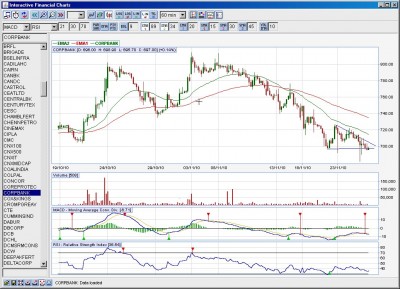
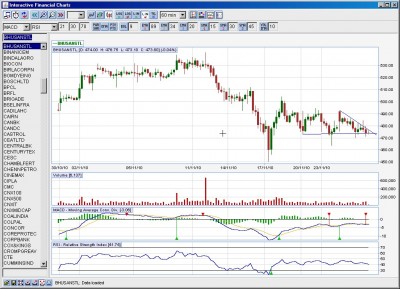
sell corp bank if sustain below 700, target 690.680.
sell bhusanstl if sustain 470. target 460.450
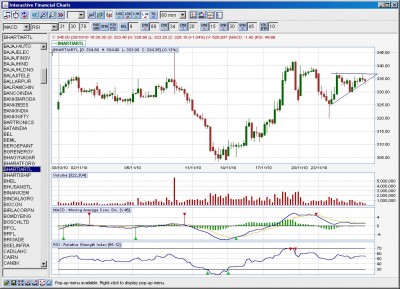
buy bhartiartl if sustain above 338. target 345.(macd is still in sell mode, but we can expect that it will be in buy mode before tht bo)
maooliservice, plz wait brother, i will post it with examples.
yawalker, i dont understand nvk clearly but looks like that. plz ask sumesh or saikat sir.
sumesh, brother plz comment
| Description: |
|
| Filesize: |
191.77 KB |
| Viewed: |
218 Time(s) |
|
| Description: |
|
| Filesize: |
188.42 KB |
| Viewed: |
229 Time(s) |
|
| Description: |
|
| Filesize: |
200.92 KB |
| Viewed: |
238 Time(s) |
|
|
|
| Back to top |
|
 |
sumesh_sol
Brown Belt

Joined: 06 Jun 2010
Posts: 2344
|
Post: #477  Posted: Thu Nov 25, 2010 1:35 pm Post subject: Re: NVK today Posted: Thu Nov 25, 2010 1:35 pm Post subject: Re: NVK today |
 |
|
| yawalkar wrote: | casper,
is this a NVK pattern today? |
Hi,
This is not the case of NVK, for nvk you have to have a -ve divergence on tops, whereas here it is actually a +ve one..
Regards,
Sumesh
|
|
| Back to top |
|
 |
sumesh_sol
Brown Belt

Joined: 06 Jun 2010
Posts: 2344
|
Post: #478  Posted: Thu Nov 25, 2010 2:42 pm Post subject: IDBI Posted: Thu Nov 25, 2010 2:42 pm Post subject: IDBI |
 |
|
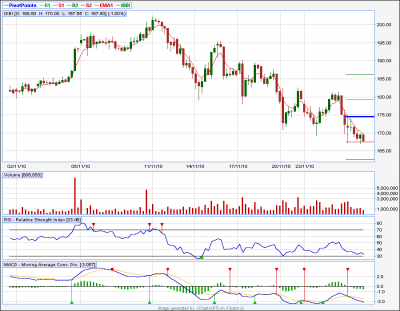
IDBI
This can break...
| Description: |
|
| Filesize: |
18.92 KB |
| Viewed: |
221 Time(s) |
|
|
|
| Back to top |
|
 |
ravionlinek
White Belt

Joined: 11 Jun 2010
Posts: 97
|
Post: #479  Posted: Thu Nov 25, 2010 3:48 pm Post subject: Posted: Thu Nov 25, 2010 3:48 pm Post subject: |
 |
|
| casper wrote: | | tata global. descending triangle in 60 min tf. macd still in buy mode, but going to make a bearish cross over and would turn in sell mode. can be shorted if a bd happens from 115 level with a target of 110 |
................................................................................................................
thanx casper made good gain out of it................
|
|
| Back to top |
|
 |
girishhu1
White Belt

Joined: 17 Aug 2009
Posts: 316
|
Post: #480  Posted: Thu Nov 25, 2010 4:44 pm Post subject: Posted: Thu Nov 25, 2010 4:44 pm Post subject: |
 |
|
hello casperji,
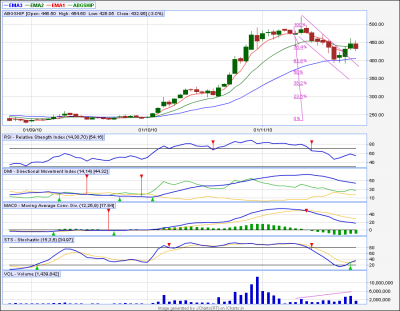
i m enclosing chart of abg shipyard. if u could read the high tight flag pattern described in 'encyclopedia of chart patterns', you can c all the identification points in this chart also, except that the stock retraced upto 38% instead of 20% prescribed in the book.can u confirm and comment, pl
regards,
girish
| Description: |
|
| Filesize: |
51.81 KB |
| Viewed: |
248 Time(s) |
|
|
|
| Back to top |
|
 |
|

