|
|
| View previous topic :: View next topic |
| Author |
a layman's approach to break out and break down |
girishhu1
White Belt

Joined: 17 Aug 2009
Posts: 316
|
Post: #496  Posted: Fri Nov 26, 2010 1:59 pm Post subject: Posted: Fri Nov 26, 2010 1:59 pm Post subject: |
 |
|
casperji,
sbi touched 2905, came down and now 2897
woooooooooooooooooooooooooo
girish
|
|
| Back to top |
|
 |
|
|  |
sumesh_sol
Brown Belt

Joined: 06 Jun 2010
Posts: 2344
|
Post: #497  Posted: Fri Nov 26, 2010 2:38 pm Post subject: SESAGOA (60tf) Posted: Fri Nov 26, 2010 2:38 pm Post subject: SESAGOA (60tf) |
 |
|
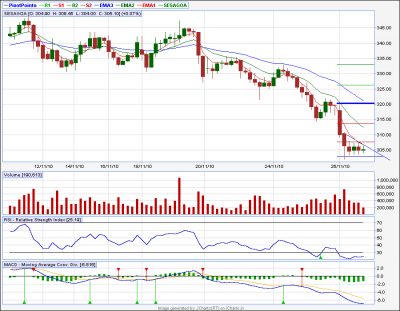
SESAGOA :
Seems like forming DT.. can break and see 300/298. Monthly S1 is at 298.
-Sumesh
| Description: |
|
| Filesize: |
20.28 KB |
| Viewed: |
288 Time(s) |
|
|
|
| Back to top |
|
 |
sumesh_sol
Brown Belt

Joined: 06 Jun 2010
Posts: 2344
|
Post: #498  Posted: Fri Nov 26, 2010 3:07 pm Post subject: Posted: Fri Nov 26, 2010 3:07 pm Post subject: |
 |
|
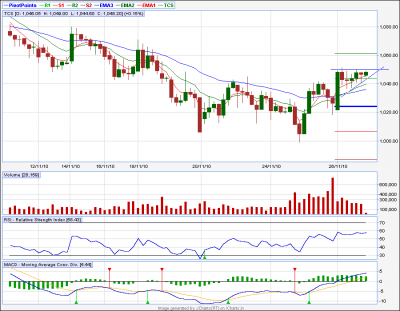
TCS looks even better now for AT.. Tgt could be 1070 & 1080
| Description: |
|
| Filesize: |
20.03 KB |
| Viewed: |
295 Time(s) |
|
|
|
| Back to top |
|
 |
casper
Green Belt

Joined: 02 Oct 2010
Posts: 1315
|
Post: #499  Posted: Sat Nov 27, 2010 1:22 pm Post subject: Posted: Sat Nov 27, 2010 1:22 pm Post subject: |
 |
|
| casper wrote: | hi vishy, welcome back
yes u r right, its a broadening top and a break down below 6000 will confirm the pattern,
in case of broadening top, we need to measure the distance of break down level from the top and project it downward, in this case, target will be some where around 5700,(my goodness)
what an extra ordinary perception u have vishy,,,,  , frankly speaking if u did not name it in ur post, i would not have dreamt of it, as it is so rare and so devastating, now after a close below 6000, we will have 5700 as a target, its still ok with me if nifty get corrected this way, but if foreign money save it this time again, then the next fall (whenever it occur) will be a tragedy , frankly speaking if u did not name it in ur post, i would not have dreamt of it, as it is so rare and so devastating, now after a close below 6000, we will have 5700 as a target, its still ok with me if nifty get corrected this way, but if foreign money save it this time again, then the next fall (whenever it occur) will be a tragedy |
hi brothers. as per our post on 12th november, nifty target is reached , again it has broken 89 ema on eod basis so if on monday some how we get a gap up opening and sustain above 89 ema then okey or else we may have more bloodbath here
thanks vishy for finding this pattern
|
|
| Back to top |
|
 |
aromal
White Belt

Joined: 22 Mar 2010
Posts: 302
|
Post: #500  Posted: Sat Nov 27, 2010 2:07 pm Post subject: Posted: Sat Nov 27, 2010 2:07 pm Post subject: |
 |
|
| girishhu1 wrote: | hi casperji,
yes bank shoots up 8%. at bo
i think we r late to enter. pl comment
regards,
girish |
 yes bank wooooooooo yes bank wooooooooo
|
|
| Back to top |
|
 |
aromal
White Belt

Joined: 22 Mar 2010
Posts: 302
|
Post: #501  Posted: Sat Nov 27, 2010 2:09 pm Post subject: Posted: Sat Nov 27, 2010 2:09 pm Post subject: |
 |
|
| girishhu1 wrote: | casperji,
sbi touched 2905, came down and now 2897
woooooooooooooooooooooooooo
girish |
sesagoa nice patternn
|
|
| Back to top |
|
 |
newinvestor
White Belt

Joined: 16 Feb 2010
Posts: 120
|
Post: #502  Posted: Sat Nov 27, 2010 3:04 pm Post subject: Posted: Sat Nov 27, 2010 3:04 pm Post subject: |
 |
|
| casper wrote: | | casper wrote: | hi vishy, welcome back
yes u r right, its a broadening top and a break down below 6000 will confirm the pattern,
in case of broadening top, we need to measure the distance of break down level from the top and project it downward, in this case, target will be some where around 5700,(my goodness)
what an extra ordinary perception u have vishy,,,,  , frankly speaking if u did not name it in ur post, i would not have dreamt of it, as it is so rare and so devastating, now after a close below 6000, we will have 5700 as a target, its still ok with me if nifty get corrected this way, but if foreign money save it this time again, then the next fall (whenever it occur) will be a tragedy , frankly speaking if u did not name it in ur post, i would not have dreamt of it, as it is so rare and so devastating, now after a close below 6000, we will have 5700 as a target, its still ok with me if nifty get corrected this way, but if foreign money save it this time again, then the next fall (whenever it occur) will be a tragedy |
hi brothers. as per our post on 12th november, nifty target is reached , again it has broken 89 ema on eod basis so if on monday some how we get a gap up opening and sustain above 89 ema then okey or else we may have more bloodbath here
thanks vishy for finding this pattern |
casper / Vishy.
Good job. Bang on target.
Casper, as per your posting with the study on breakouts, you had said that if backed by a supportive MACD and RSI, one can take a position before the BO happens ( as the pattern is forming).
So, in this case, as soon as a Broadening top formation was assumed , one could go short ( as the MACD and RSI were both bearish), for an initial target of 6000, and thereafter , after the breakdown below 6000 for the target of 5700.
Is my understanding correct? What would have been the right stop losses in both the cases?
|
|
| Back to top |
|
 |
vishytns
White Belt

Joined: 26 Nov 2009
Posts: 206
|
Post: #503  Posted: Sat Nov 27, 2010 6:36 pm Post subject: Posted: Sat Nov 27, 2010 6:36 pm Post subject: |
 |
|
newinvestor,
Please refer the site http://thepatternsite.com to know more about the pattern. Actually domestic events happening around us made this pattern look stronger. If you find the answers to your questions from the site mentioned you will know why I am saying this. Site also explains how to trade this particular pattern. As an excersize you can try finding this pattern in many of the nifty stocks. Find them and analyze them.
casper,
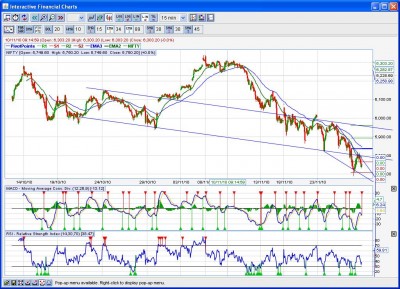
Please check the attached chart and provide your comments. This is a h/s in nifty, price has broken down the neck line, and there is also a retracement to neckline.
If anybody wants to trade this pattern, neck line would be the stop loss. You have to be carefull because most of the indicators are oversold so we could have consolidation/pullback/even pattern might fail. So please be careful.
Vishy.
| Description: |
|
| Filesize: |
167.54 KB |
| Viewed: |
336 Time(s) |
|
|
|
| Back to top |
|
 |
sumesh_sol
Brown Belt

Joined: 06 Jun 2010
Posts: 2344
|
Post: #504  Posted: Sun Nov 28, 2010 12:06 am Post subject: Posted: Sun Nov 28, 2010 12:06 am Post subject: |
 |
|
Friday's testing result..
****************************
As I could not find much time I could trade only few. The results are as below:
1.)SAIL (AT Long ):worked for me and I booked 50% at tgt1, rest 50% stopped out on trailing..
2.)Sesagoa (DT Shorted): It tumbled to give me both of my tgts, (in fact more than that, but I was out already !)
3.)TCS (AT Long): Entered long, however closed near to BO level.. I expect it to move higher on monday
There were two trades which were opened a day before:
1.)IDBI (DT Short): It fell down like anything..
2.)BEL (AT Long) : Stopped out !!! The first of my trades in this series, where I was stopped out.. It was making weird moves.. In fact , like I mentioned earlier I entered a bit early than actual BO into this, so had to pay the price 
Cheers,
Sumesh
|
|
| Back to top |
|
 |
newinvestor
White Belt

Joined: 16 Feb 2010
Posts: 120
|
Post: #505  Posted: Sun Nov 28, 2010 8:10 am Post subject: Posted: Sun Nov 28, 2010 8:10 am Post subject: |
 |
|
| sumesh_sol wrote: | Friday's testing result..
****************************
As I could not find much time I could trade only few. The results are as below:
1.)SAIL (AT Long ):worked for me and I booked 50% at tgt1, rest 50% stopped out on trailing..
2.)Sesagoa (DT Shorted): It tumbled to give me both of my tgts, (in fact more than that, but I was out already !)
3.)TCS (AT Long): Entered long, however closed near to BO level.. I expect it to move higher on monday
There were two trades which were opened a day before:
1.)IDBI (DT Short): It fell down like anything..
2.)BEL (AT Long) : Stopped out !!! The first of my trades in this series, where I was stopped out.. It was making weird moves.. In fact , like I mentioned earlier I entered a bit early than actual BO into this, so had to pay the price 
Cheers,
Sumesh |
Sumesh, did you do these trades using the 5 min tf ?
|
|
| Back to top |
|
 |
casper
Green Belt

Joined: 02 Oct 2010
Posts: 1315
|
Post: #506  Posted: Sun Nov 28, 2010 8:57 am Post subject: Posted: Sun Nov 28, 2010 8:57 am Post subject: |
 |
|
hi newinvestor,
all i what wrote in the doc files i posted is true only about triangles and pennants. i have not checked it in other patterns. but if any one wanted to short, depending on the chart. he could short.
when vishy mentioned the pattern, nifty made a high of 6300 aprx and was going down .(making a high means that is the highest point , then down trend/correction started) and nifty was around 6100, so in this case a positional trader can easily short nifty with a target of 6000. various types of stop loss could be used also, depending upon the risk appetite of the trader, while the simplest sl would be a close above the recent high, because by any means if nifty could successfully close above the recent high of 6300 aprx then the pattern would lost its significance and turned to be a case of higher highs, that means nifty would establish its up trend once again, in that case we would close our short because it would be meaningless by then
when 6000 was broken, the pattern reached its break down phase, so the trader who has earlier shorted nifty now can add more short positions there
as of now, we can also make a risky short. we can short nifty at cmp and take an sl of a close above 89 ema, our oscillators are oversold so short will be risky and nifty is an index which is the average of 50 stocks so it does not follow the chart exactly and various fundamental news plays a role in its movement as good as chart patterns do. so it can bounce back any time but practically there is no support upto 5500 as per chart readings
|
|
| Back to top |
|
 |
casper
Green Belt

Joined: 02 Oct 2010
Posts: 1315
|
Post: #507  Posted: Sun Nov 28, 2010 9:14 am Post subject: Posted: Sun Nov 28, 2010 9:14 am Post subject: |
 |
|
| vishytns wrote: | newinvestor,
Please refer the site http://thepatternsite.com to know more about the pattern. Actually domestic events happening around us made this pattern look stronger. If you find the answers to your questions from the site mentioned you will know why I am saying this. Site also explains how to trade this particular pattern. As an excersize you can try finding this pattern in many of the nifty stocks. Find them and analyze them.
casper,
Please check the attached chart and provide your comments. This is a h/s in nifty, price has broken down the neck line, and there is also a retracement to neckline.
If anybody wants to trade this pattern, neck line would be the stop loss. You have to be carefull because most of the indicators are oversold so we could have consolidation/pullback/even pattern might fail. So please be careful.
Vishy. |
hi brother,
we have already discussed about it last night but still i am posting here for others.
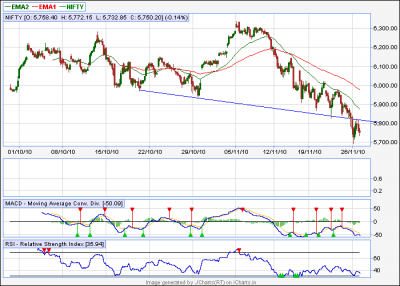
this h/s pattern is also seen in 60 min tf. its a devastating pattern, it gave a bd and then pull back upto 5800 level but this pullback could not sustain above 5800 means the chance of pul back hampering the bearishness and inject fresh bullishness in nifty has gone at least for now
being the height of the pattern is aprox 400 pts, we can expect a target of 5500
my attachment is of 60 min tf
| Description: |
|
| Filesize: |
15.79 KB |
| Viewed: |
265 Time(s) |
|
|
|
| Back to top |
|
 |
mrvishal_g
White Belt

Joined: 17 Sep 2010
Posts: 89
|
Post: #508  Posted: Sun Nov 28, 2010 2:14 pm Post subject: Posted: Sun Nov 28, 2010 2:14 pm Post subject: |
 |
|
Hi Casper,
Please comment on following
Geshiping 370.....buy a flag (bullish) but RSI and MACD is not clearing supporting while the breakout is aready happened on weekly chart (AT) where RSI and MACD is also supporting
HindZinc 1105...sell it is broken trendline support, RSI and MACD is also favoring.
Jindal Steel 612....sell it has broken important support and rectable bd is going to happen on weekly chart below 600
Please also mention that which one is looking more reliable.
Vishal
|
|
| Back to top |
|
 |
chandrujimrc
Brown Belt

Joined: 21 Apr 2009
Posts: 1683
|
Post: #509  Posted: Sun Nov 28, 2010 2:43 pm Post subject: a laymans" approach to breakout and breakdown Posted: Sun Nov 28, 2010 2:43 pm Post subject: a laymans" approach to breakout and breakdown |
 |
|
Hi casperji,
If your time permits pl comment on canbk,bpcl and bartronics.
chandru.
|
|
| Back to top |
|
 |
jjm
White Belt

Joined: 17 Mar 2010
Posts: 411
|
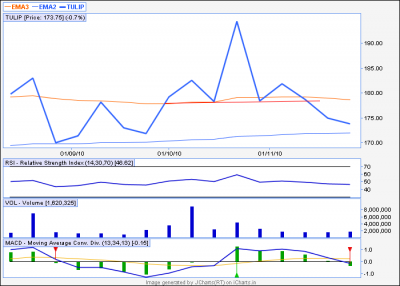
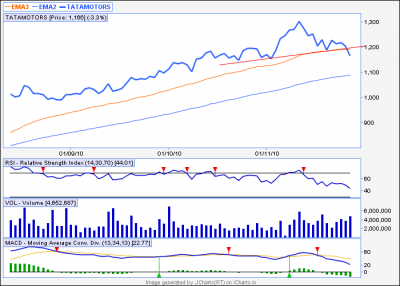
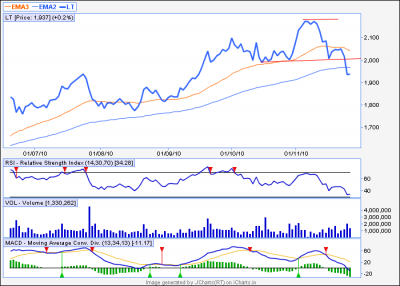
Post: #510  Posted: Sun Nov 28, 2010 2:49 pm Post subject: LT, TAMO, TULIP Posted: Sun Nov 28, 2010 2:49 pm Post subject: LT, TAMO, TULIP |
 |
|
Dear Casper/Sumesh,
Hv a look at these..do we need wait for price to touch neck line to validate the pattern or we can take position at current prices
Or do we take position on rejection on 13,21 or 34 EMA in 60 TF,
Friday SGN nifty closed above 5800 so expecting a gap up on Monday...,how to initiate trade in that case
Regards,
JJM
| Description: |
|
| Filesize: |
30.33 KB |
| Viewed: |
263 Time(s) |
|
| Description: |
|
| Filesize: |
30.16 KB |
| Viewed: |
279 Time(s) |
|
| Description: |
|
| Filesize: |
33.32 KB |
| Viewed: |
249 Time(s) |
|
|
|
| Back to top |
|
 |
|
|
You cannot post new topics in this forum
You cannot reply to topics in this forum
You cannot edit your posts in this forum
You cannot delete your posts in this forum
You cannot vote in polls in this forum
You can attach files in this forum
You can download files in this forum
|
Powered by phpBB © 2001, 2005 phpBB Group
|
|
|

