|
|
| View previous topic :: View next topic |
| Author |
a layman's approach to break out and break down |
vvsp
White Belt

Joined: 10 Nov 2010
Posts: 62
|
Post: #511  Posted: Sun Nov 28, 2010 4:42 pm Post subject: Posted: Sun Nov 28, 2010 4:42 pm Post subject: |
 |
|
| sumesh_sol wrote: | Friday's testing result..
****************************
As I could not find much time I could trade only few. The results are as below:
1.)SAIL (AT Long ):worked for me and I booked 50% at tgt1, rest 50% stopped out on trailing..
2.)Sesagoa (DT Shorted): It tumbled to give me both of my tgts, (in fact more than that, but I was out already !)
3.)TCS (AT Long): Entered long, however closed near to BO level.. I expect it to move higher on monday
There were two trades which were opened a day before:
1.)IDBI (DT Short): It fell down like anything..
2.)BEL (AT Long) : Stopped out !!! The first of my trades in this series, where I was stopped out.. It was making weird moves.. In fact , like I mentioned earlier I entered a bit early than actual BO into this, so had to pay the price 
Cheers,
Sumesh |
BEL is a low volume stock. This could be one of the reasons for not obliging to technical analysis.
|
|
| Back to top |
|
 |
|
|  |
casper
Green Belt

Joined: 02 Oct 2010
Posts: 1315
|
Post: #512  Posted: Sun Nov 28, 2010 6:50 pm Post subject: Posted: Sun Nov 28, 2010 6:50 pm Post subject: |
 |
|
hi all here is the reply to ur questions 
1.ge ship= its consolidating between 354-380 in daily chart. macd /rsi in sell mode. in weekly chart it is retracing to bo level,(360)u can enter with a bo in the daily chart i hope macd/rsi will be positive my then
2.hindzinc= it closed at 200ema . a down move from here can reach 1110,915 level
3.jindalstel= in weekly chart going to bd rsi going down and macd in sell mode, daily also same case, but rsi in daily is oversold,
a bd in weekly chart can take us at 500-450 level
4.canbk=got support from 89ema and closed within the bolinger band (20.2) i think down move will stop from here, here it may consolidate even may go up
5.bpcl= broken down from descending triangle. closed at support of 200 ema, a down move below 650 is needed for fresh short, in that case target would be 635-610
6.bartronics=broken down from a descending triangle. target would be 80,78,75
7.tulip= weekly= it has broken down from h/s already and taken support at 89ema a further fall will take us upto 165 level
daily=moving in a channel of 170 to 200, can take support here and go up, but if 170 is broken down then target will be 150-140
8.tatamotors=nice h/s but wait for a bd,i hv not tested my method for h/s
so can not advice u to go short now as in candlestick charts the neck line is intact now. u can go short if it breaches 1130
9.lt= nice finding brother, target 1800, its the patterns target as well as 200 ema, so expect resistance here
|
|
| Back to top |
|
 |
maooliservice
White Belt

Joined: 04 Aug 2010
Posts: 93
|
Post: #513  Posted: Sun Nov 28, 2010 8:08 pm Post subject: Posted: Sun Nov 28, 2010 8:08 pm Post subject: |
 |
|
dear casper(junior),
below quotes r from ur one article.
alternatively u can find ur entry and sl levels if u use the calculator option under the calculator tab on ichart home page. use fibo to find out entry and exit point. plz note here that if u see a gap down with respect to fivo entry point, then for 95% cases u can buy blindly, it will pay off and if its gap up with respect to fivo entry point, just sell it and book at designated fivo entry point, u can use it for any choppy day. it works really good
can u explain this with the help of chart
|
|
| Back to top |
|
 |
casper
Green Belt

Joined: 02 Oct 2010
Posts: 1315
|
Post: #514  Posted: Sun Nov 28, 2010 9:47 pm Post subject: Posted: Sun Nov 28, 2010 9:47 pm Post subject: |
 |
|
dear brother, i can explain it easily but could not find chart last time when u asked me, because this thing i noticed for choppy markets only. it has no room for trending markets like which we have now.
this kind of phenomenon was last noticed by me in end of august this year. u can understand that now in November i cant get real time chart of august easily
so here i am writting how i took this kinds of trades during a choppy day. and i will surely post supporting charts if i find one.
in those days my work started with candle stick screeners . we have one such screener installed in ichart, but i used another free website for this purpose, that particular website is all about technical screner and quite helpful too but i can not name it here due to forum rules
however, the idea is to find out candle stick patterns like morning star, evening star,and other reliable patterns,and one can do it from ichart also even can do it manually also
plz find the calculator link on the left hand side of the ichart web page and click it, u will see from that link u can calculate fibonacci and pivot levels, i liked the fibonacci option because it give u clear mentioned entry/sl/ and three targets
in order to calculate the enrty/sl/target we need to enter the days high and days close for short and in order to calculate a long entry we need to enter the days low and closing price
now suppose u get an evening star pattern on which we are supposed to take intra day trades, we will enter the days high and closing price for next day's trading, this calculator will generate
1. where to short
2.what is sl
3. target 1/target/2target3 (in addition to that it will generate reversal targets which are useful if ur stop loss is hit and u reverse the short trade into a long trade, but that's not our look out now)
this calculation we are doing before market
now come to the market, in those days(may be even today) nifty had a tendency to take a lead directly from sgx nifty, if we have a higher sgx nifty during our market opening, it would be a gap up and if we have a lower sgx nifty price, then it would be a gap down
now what i wanted to say,
let us assume that we have got the following fibonacci data on a stock named xyz
short= 100
stop loss=102
target=98.5
97
94.75
so we will expect that the stock will open at 100 or higher and will go down gradually
but in real time,due to gap down and choppy move suppose we have an opening around 96
in this case i have seen that the stock will generally not go down from 96 level to 94 level. but due to choppiness, mind u brother, only due to choppiness it will try to move up and will move up to 98.5>100>102 level
the same case is true for up trending stock such as stock formed morning star pattern but opened with a gap up. in that case it will open around higher levels and due to choppiness it will try to go down
in those days it was as if the stock had a quota to move. if it opens at higher level then will go down and if it opens at lower level it will go up
but remember this is for intraday only and that too only during choppy market, during trending market i hv never seen this, so plz dont try to apply this in this kind of heavily trending market
|
|
| Back to top |
|
 |
anand1234
Yellow Belt

Joined: 17 Jul 2010
Posts: 830
|
Post: #515  Posted: Mon Nov 29, 2010 9:57 am Post subject: Posted: Mon Nov 29, 2010 9:57 am Post subject: |
 |
|
hi.........casper........
I purchased hcc @66.5.............but now it is @39.................
shd it get reveresd from here?.........how long shd I hold??.pls guide me........
thanks
anand
|
|
| Back to top |
|
 |
sumesh_sol
Brown Belt

Joined: 06 Jun 2010
Posts: 2344
|
Post: #516  Posted: Mon Nov 29, 2010 11:43 am Post subject: NAGARCONST 60tf.. Posted: Mon Nov 29, 2010 11:43 am Post subject: NAGARCONST 60tf.. |
 |
|
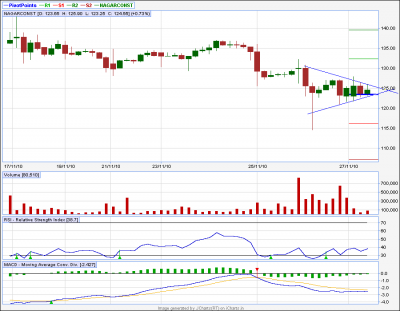
NAGARCONST 60tf...
This appears to be a ST . RSI favourable, MACD is not in buy mode so far, but may come. Taking a chance on upper side BO.
Tgts 130.7 & 131.7. SL (after trade is entered) 122.6.. Take your own decision...
newinvestors: I think you asked me in one of your post abt TF I use, it is always 60tf, and I always mention it while posting... I have found this TF as most reliable
-Sumesh
| Description: |
|
| Filesize: |
14.79 KB |
| Viewed: |
251 Time(s) |

|
|
|
| Back to top |
|
 |
sumesh_sol
Brown Belt

Joined: 06 Jun 2010
Posts: 2344
|
Post: #517  Posted: Mon Nov 29, 2010 12:07 pm Post subject: APOLLO 60tf Posted: Mon Nov 29, 2010 12:07 pm Post subject: APOLLO 60tf |
 |
|
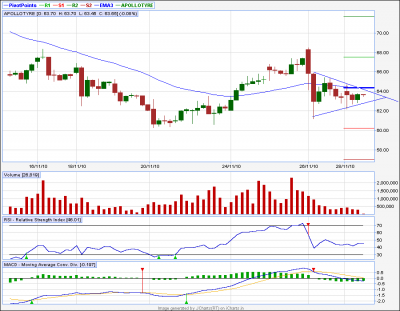
APOLLO 60tf:
Another ST..
MACD -ve, RSI flat to negative and could turn -ve on breakdown, my tgt 60.5
-Sumesh
| Description: |
|
| Filesize: |
16.31 KB |
| Viewed: |
272 Time(s) |

|
|
|
| Back to top |
|
 |
sumesh_sol
Brown Belt

Joined: 06 Jun 2010
Posts: 2344
|
Post: #518  Posted: Mon Nov 29, 2010 12:19 pm Post subject: COALINDIA Posted: Mon Nov 29, 2010 12:19 pm Post subject: COALINDIA |
 |
|
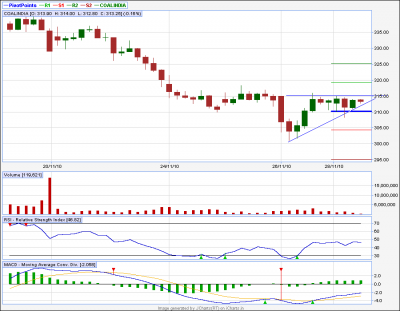
COALINDIA:(60tf)
AT in formation..
MY Upper tgts are 318/324.. You can adjust for yourself.
-SUmesh
| Description: |
|
| Filesize: |
14.08 KB |
| Viewed: |
291 Time(s) |

|
|
|
| Back to top |
|
 |
sumesh_sol
Brown Belt

Joined: 06 Jun 2010
Posts: 2344
|
Post: #519  Posted: Mon Nov 29, 2010 3:55 pm Post subject: Today's testing result(monday) Posted: Mon Nov 29, 2010 3:55 pm Post subject: Today's testing result(monday) |
 |
|
Today's testing result:
**********************
1.) COALINDIA(Long) : Achieved 1st tgt.. second can come tomorrow.
2.) NagarConst(Long) : MACD has also turned now in buy mode at the, can expect tgt to meet tomorrow..
3.) ApolloTyre (Short) : BD did not happen, so not traded.
You might be wondering as to why I have been posting *MY* testing results in the public forum. Well, it has two reasons. First I always post the pattern before the tradeable BO/BD happens and then follow up the same by posting result, to let everyone *understand* the pattern. This instill confidence in YOU as well as in ME about the type of trading we r doing. Secondly, it also documents the patterns for future reference…
Now, As I am 90% confident of the setup, I shall increase my exposure from tomorrow onwards.
Regards,
Sumesh
|
|
| Back to top |
|
 |
singh.ravee
Yellow Belt

Joined: 12 Aug 2010
Posts: 678
|
Post: #520  Posted: Mon Nov 29, 2010 5:37 pm Post subject: Posted: Mon Nov 29, 2010 5:37 pm Post subject: |
 |
|
sumesh hello,
i read many of your previous postings. There is a wide variety of stocks that u trade in. May, i learn from you, how u select a particular stock out of all the stocks traded.
rgd
ravee
|
|
| Back to top |
|
 |
casper
Green Belt

Joined: 02 Oct 2010
Posts: 1315
|
Post: #521  Posted: Mon Nov 29, 2010 6:25 pm Post subject: Posted: Mon Nov 29, 2010 6:25 pm Post subject: |
 |
|
| anand1234 wrote: | hi.........casper........
I purchased hcc @66.5.............but now it is @39.................
shd it get reveresd from here?.........how long shd I hold??.pls guide me........
thanks
anand |
sorry brother im late to reply.
may be seven days ago u asked me the same question, hcc was around 56, i told u to short it with a target of 50 or so. today i am shocked to learn that u r still holding it
as of now it has closed in a dozi candle with heavy volume, i expect its down move will choke for now and with a green candle tomorrow it may start going up
besides. in 60 min tf it has formed a symmetrical triangle where macd and rsi seems to be bullish, so i hope from tomorrow it will start going up.
i think u should average the stock around cmp to get out of it as fast as possible
|
|
| Back to top |
|
 |
newinvestor
White Belt

Joined: 16 Feb 2010
Posts: 120
|
Post: #522  Posted: Mon Nov 29, 2010 6:45 pm Post subject: Re: Today's testing result(monday) Posted: Mon Nov 29, 2010 6:45 pm Post subject: Re: Today's testing result(monday) |
 |
|
| sumesh_sol wrote: | Today's testing result:
**********************
1.) COALINDIA(Long) : Achieved 1st tgt.. second can come tomorrow.
2.) NagarConst(Long) : MACD has also turned now in buy mode at the, can expect tgt to meet tomorrow..
3.) ApolloTyre (Short) : BD did not happen, so not traded.
You might be wondering as to why I have been posting *MY* testing results in the public forum. Well, it has two reasons. First I always post the pattern before the tradeable BO/BD happens and then follow up the same by posting result, to let everyone *understand* the pattern. This instill confidence in YOU as well as in ME about the type of trading we r doing. Secondly, it also documents the patterns for future reference…
Now, As I am 90% confident of the setup, I shall increase my exposure from tomorrow onwards.
Regards,
Sumesh |
Thats good Sumesh, helps us learn.
Keep it going.
|
|
| Back to top |
|
 |
newinvestor
White Belt

Joined: 16 Feb 2010
Posts: 120
|
Post: #523  Posted: Mon Nov 29, 2010 6:46 pm Post subject: Posted: Mon Nov 29, 2010 6:46 pm Post subject: |
 |
|
| Casper, what are your views on Jindal Poly?
|
|
| Back to top |
|
 |
casper
Green Belt

Joined: 02 Oct 2010
Posts: 1315
|
Post: #524  Posted: Mon Nov 29, 2010 6:59 pm Post subject: Posted: Mon Nov 29, 2010 6:59 pm Post subject: |
 |
|
| casper wrote: | dear brother, i can explain it easily but could not find chart last time when u asked me, because this thing i noticed for choppy markets only. it has no room for trending markets like which we have now.
this kind of phenomenon was last noticed by me in end of august this year. u can understand that now in November i cant get real time chart of august easily
so here i am writting how i took this kinds of trades during a choppy day. and i will surely post supporting charts if i find one.
in those days my work started with candle stick screeners . we have one such screener installed in ichart, but i used another free website for this purpose, that particular website is all about technical screner and quite helpful too but i can not name it here due to forum rules
however, the idea is to find out candle stick patterns like morning star, evening star,and other reliable patterns,and one can do it from ichart also even can do it manually also
plz find the calculator link on the left hand side of the ichart web page and click it, u will see from that link u can calculate fibonacci and pivot levels, i liked the fibonacci option because it give u clear mentioned entry/sl/ and three targets
in order to calculate the enrty/sl/target we need to enter the days high and days close for short and in order to calculate a long entry we need to enter the days low and closing price
now suppose u get an evening star pattern on which we are supposed to take intra day trades, we will enter the days high and closing price for next day's trading, this calculator will generate
1. where to short
2.what is sl
3. target 1/target/2target3 (in addition to that it will generate reversal targets which are useful if ur stop loss is hit and u reverse the short trade into a long trade, but that's not our look out now)
this calculation we are doing before market
now come to the market, in those days(may be even today) nifty had a tendency to take a lead directly from sgx nifty, if we have a higher sgx nifty during our market opening, it would be a gap up and if we have a lower sgx nifty price, then it would be a gap down
now what i wanted to say,
let us assume that we have got the following fibonacci data on a stock named xyz
short= 100
stop loss=102
target=98.5
97
94.75
so we will expect that the stock will open at 100 or higher and will go down gradually
but in real time,due to gap down and choppy move suppose we have an opening around 96
in this case i have seen that the stock will generally not go down from 96 level to 94 level. but due to choppiness, mind u brother, only due to choppiness it will try to move up and will move up to 98.5>100>102 level
the same case is true for up trending stock such as stock formed morning star pattern but opened with a gap up. in that case it will open around higher levels and due to choppiness it will try to go down
in those days it was as if the stock had a quota to move. if it opens at higher level then will go down and if it opens at lower level it will go up
but remember this is for intraday only and that too only during choppy market, during trending market i hv never seen this, so plz dont try to apply this in this kind of heavily trending market |
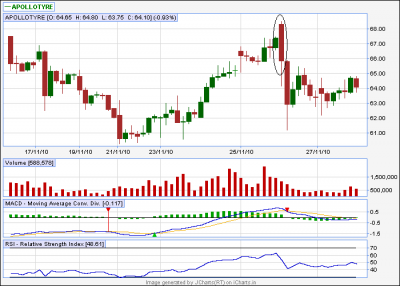
suddenly i have seen a chart showing what i wanted to say
plz look at the two candles i have marked in this chart
the 1st green candle has a low of 66.60 and close at 67.40
now if we are to trade next candle depending on the fibonacci calculation of this green candle we will get the following data
buy 67.05
sl 66.65
targets= 68.10/68.75/69.80
but the very next candle, which is a red one as u see, opened at 69.30, meaning a sort of "upper circuit opening" and then made a high of 69.50 and gradually went down to 64.15 and finally closed at 65.85
from this example i think u can guess what i wanted to say for a choppy day. but then its an hourly chart, its not a choppy day chart so dont think that price will close here, and it has gone down even further
just for example purpose i am posting this chart as no eod chart is at my disposal now
so i will remind u that what i said was on eod basis, and im posting this chart only for example
checking newinvestor
| Description: |
|
| Filesize: |
21.49 KB |
| Viewed: |
272 Time(s) |

|
|
|
| Back to top |
|
 |
casper
Green Belt

Joined: 02 Oct 2010
Posts: 1315
|
Post: #525  Posted: Mon Nov 29, 2010 7:43 pm Post subject: Posted: Mon Nov 29, 2010 7:43 pm Post subject: |
 |
|
| newinvestor wrote: | | Casper, what are your views on Jindal Poly? |
i could not identify any pattern, it looks like a case of broadening top bd. which already taken the target now after getting support from lower bolinger band its going up
474 will be a resistance as 89 ema in eod chart is present here above that we can buy it with a target of 510. above that 545-550 is going to be the toughest resistance in near term as all the short term moving averages are hovering here
above 550 we can expect a target upto 700
|
|
| Back to top |
|
 |
|
|
You cannot post new topics in this forum
You cannot reply to topics in this forum
You cannot edit your posts in this forum
You cannot delete your posts in this forum
You cannot vote in polls in this forum
You can attach files in this forum
You can download files in this forum
|
Powered by phpBB © 2001, 2005 phpBB Group
|
|
|

