|
|
| View previous topic :: View next topic |
| Author |
a layman's approach to break out and break down |
casper
Green Belt

Joined: 02 Oct 2010
Posts: 1315
|
Post: #556  Posted: Wed Dec 01, 2010 12:57 pm Post subject: Posted: Wed Dec 01, 2010 12:57 pm Post subject: |
 |
|
| anand1234 wrote: | hi.........casper
I am asking u out of the track..........can u tell me about the areydrg(bse).........I purchased @54 before 1 year.........now it is moving slowley..........can u tell me how long I shd hold it for the tgt........pls guide me........
thanks
anand |
i could not find its code, plz tell me its bse code
|
|
| Back to top |
|
 |
|
|  |
vrushabh123
White Belt

Joined: 18 Nov 2010
Posts: 39
|
Post: #557  Posted: Wed Dec 01, 2010 12:59 pm Post subject: hey casper Posted: Wed Dec 01, 2010 12:59 pm Post subject: hey casper |
 |
|
| casper.. pivots tht r given below the chart like icharts n fibonacce n all u talking abt.. if it is then how to check which is wkly n mthly..
|
|
| Back to top |
|
 |
casper
Green Belt

Joined: 02 Oct 2010
Posts: 1315
|
Post: #558  Posted: Wed Dec 01, 2010 1:11 pm Post subject: Re: hey casper Posted: Wed Dec 01, 2010 1:11 pm Post subject: Re: hey casper |
 |
|
| vrushabh123 wrote: | | casper.. pivots tht r given below the chart like icharts n fibonacce n all u talking abt.. if it is then how to check which is wkly n mthly.. |
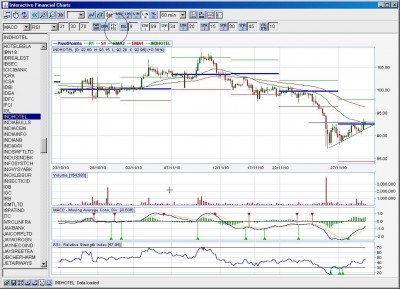
they are daily pivot. i am not talking about those pivots,
see the posted chart. i hv marked the pivot point button with a circle, it is situated at the upper panel.click that button in jchart u will get monthly and weekly pivots
| Description: |
|
| Filesize: |
149.93 KB |
| Viewed: |
259 Time(s) |
|
|
|
| Back to top |
|
 |
anand1234
Yellow Belt

Joined: 17 Jul 2010
Posts: 830
|
Post: #559  Posted: Wed Dec 01, 2010 1:13 pm Post subject: Posted: Wed Dec 01, 2010 1:13 pm Post subject: |
 |
|
hi.........casper.....
areydrg (bse code-524412).....
pls confirm the same................
thanks
anand
|
|
| Back to top |
|
 |
vrushabh123
White Belt

Joined: 18 Nov 2010
Posts: 39
|
Post: #560  Posted: Wed Dec 01, 2010 1:22 pm Post subject: hi Posted: Wed Dec 01, 2010 1:22 pm Post subject: hi |
 |
|
alright.... i got it.. thanks man.. n ceat also A.T i hve not checked pivots..i will just check it.. Thanks.. 
|
|
| Back to top |
|
 |
casper
Green Belt

Joined: 02 Oct 2010
Posts: 1315
|
Post: #561  Posted: Wed Dec 01, 2010 1:22 pm Post subject: Posted: Wed Dec 01, 2010 1:22 pm Post subject: |
 |
|
| anand1234 wrote: | hi.........casper.....
areydrg (bse code-524412).....
pls confirm the same................
thanks
anand |
forming a sort of rounding bottom. 40 should be the toughest point to break, above 40 we can expect 60 but this will take time brother
|
|
| Back to top |
|
 |
yawalkar
White Belt

Joined: 02 Oct 2010
Posts: 58
|
Post: #562  Posted: Wed Dec 01, 2010 7:10 pm Post subject: TATA MOTORS Posted: Wed Dec 01, 2010 7:10 pm Post subject: TATA MOTORS |
 |
|
Dear Casper,
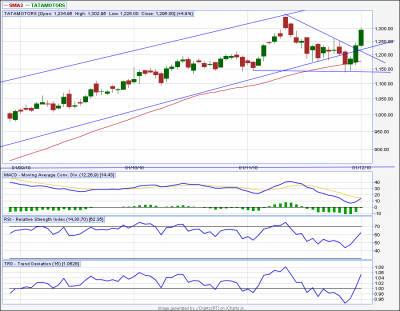
see chart of tata motors.
Pls. comment on it
| Description: |
|
| Filesize: |
47.97 KB |
| Viewed: |
304 Time(s) |
|
|
|
| Back to top |
|
 |
yawalkar
White Belt

Joined: 02 Oct 2010
Posts: 58
|
Post: #563  Posted: Wed Dec 01, 2010 7:29 pm Post subject: cipla Posted: Wed Dec 01, 2010 7:29 pm Post subject: cipla |
 |
|
dear casper,
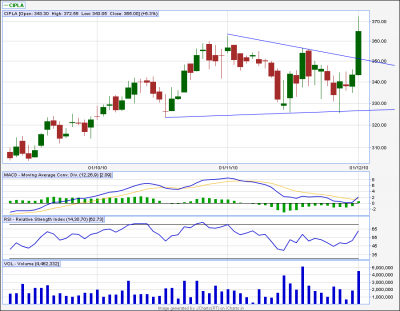
see chart of cipla
can you explain me for tgt.,
how to calculate tgt for bo/bd stocks?
| Description: |
|
| Filesize: |
29.04 KB |
| Viewed: |
300 Time(s) |
|
|
|
| Back to top |
|
 |
mrvishal_g
White Belt

Joined: 17 Sep 2010
Posts: 89
|
Post: #564  Posted: Wed Dec 01, 2010 11:07 pm Post subject: Posted: Wed Dec 01, 2010 11:07 pm Post subject: |
 |
|
| mrvishal_g wrote: | | casper wrote: | u should book it as the sl was hit, i can understand why u have not booked it. now i expect it to come down at 200 level atleast, close it then
always close ur deals when sl are hit, small loss will save u from big loss |
I have not booked bcoz these days are so volatile and it was possible to close 205, in that case call was still open
Now i will book near 201 (my rate)
Thanks
Vishal |
Hi Casper,
When i open icharts i always say thanks to God and IChart who give me friends like u with whom i can chat and discuss.
Well i booked a big loss in Hindalco bcoz it was not coming down.
I decided that i will not trade in f&o atleast for few days and also start paper trade to check my accuracy level and i will give atleast some time every day for study. If it is possible (pl dont mind)then call me at once i would like ask something personal Vishal <REMOVED>
|
|
| Back to top |
|
 |
casper
Green Belt

Joined: 02 Oct 2010
Posts: 1315
|
Post: #565  Posted: Thu Dec 02, 2010 8:35 am Post subject: Posted: Thu Dec 02, 2010 8:35 am Post subject: |
 |
|
hi yawalkar.
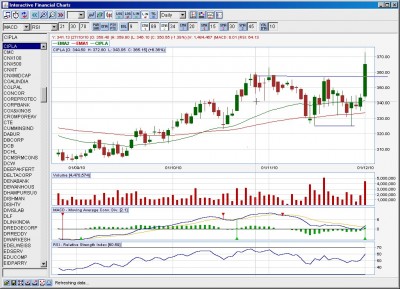
in case of cipla , u have posted a sort of descending triangle.its a bearish pattern so it can not explain the up move, but we need to explain the upmove in order to trade it
so now, with ur permission, i have changed it to be a double bottom reversal 
here for a target projection, we need to measure the distance between both of the bottoms and their intermediate top,
here we have a bottom of 325 and top of 356, so the distance will be 31. now we need tp project this 31 from the bo level, means from 356 level( because when price is crossing 356 for 2nd time then only the break out is taking place.)
so we have a target of 387. its safe to target between 380-385 and then trail the stop loss
but here one thing i must say that we have got a buy signal from macd only on the bo candle. in case of intraday trading we have seen if we get a buy signal on the bo candle the the bo is generally false, so we need a buy signal from macd before the bo occur, however we have not checked it in eod basis. so i can not say that this bo will be false. but we need to be watchful
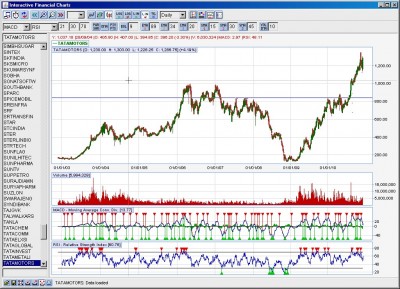
again in tata motor, the pattern u posted was a descending triangle and can not explain the up move,
but only if we take a much larger view then we can see that this pattern is a part of a much bigger cup and handle or rounding bottom
( we may call it rounding bottom because the handle part is not so developed)
if we call it cup and handle then we have a target of 1400 and if we call it rounding bottom, then we have a target of 1600
i am posting the cup and handle version. if u want to say its rounding bottom, then we have to consider the previous high in left hand side, but its good to advance step by step, let us take out 1400, then we will move for 1600
| Description: |
|
| Filesize: |
226.43 KB |
| Viewed: |
272 Time(s) |
|
| Description: |
|
| Filesize: |
198.75 KB |
| Viewed: |
280 Time(s) |
|
|
|
| Back to top |
|
 |
yawalkar
White Belt

Joined: 02 Oct 2010
Posts: 58
|
Post: #566  Posted: Thu Dec 02, 2010 9:10 am Post subject: Posted: Thu Dec 02, 2010 9:10 am Post subject: |
 |
|
| casper wrote: | hi yawalkar.
in case of cipla , u have posted a sort of descending triangle.its a bearish pattern so it can not explain the up move, but we need to explain the upmove in order to trade it
so now, with ur permission, i have changed it to be a double bottom reversal 
here for a target projection, we need to measure the distance between both of the bottoms and their intermediate top,
here we have a bottom of 325 and top of 356, so the distance will be 31. now we need tp project this 31 from the bo level, means from 356 level( because when price is crossing 356 for 2nd time then only the break out is taking place.)
so we have a target of 387. its safe to target between 380-385 and then trail the stop loss
but here one thing i must say that we have got a buy signal from macd only on the bo candle. in case of intraday trading we have seen if we get a buy signal on the bo candle the the bo is generally false, so we need a buy signal from macd before the bo occur, however we have not checked it in eod basis. so i can not say that this bo will be false. but we need to be watchful
again in tata motor, the pattern u posted was a descending triangle and can not explain the up move,
but only if we take a much larger view then we can see that this pattern is a part of a much bigger cup and handle or rounding bottom
( we may call it rounding bottom because the handle part is not so developed)
if we call it cup and handle then we have a target of 1400 and if we call it rounding bottom, then we have a target of 1600
i am posting the cup and handle version. if u want to say its rounding bottom, then we have to consider the previous high in left hand side, but its good to advance step by step, let us take out 1400, then we will move for 1600 |
Thanks Brother..
|
|
| Back to top |
|
 |
kamal.icharts
Site Admin
Joined: 10 Apr 2013
Posts: 576
|
|
| Back to top |
|
 |
pennywise
White Belt

Joined: 23 Jan 2010
Posts: 18
|
Post: #568  Posted: Thu Dec 02, 2010 10:29 am Post subject: Posted: Thu Dec 02, 2010 10:29 am Post subject: |
 |
|
Casper,
In case of Cipla, as it has created a new 52-wk yesterday, the price may appreciate further, after initially falling down a little bit in the next few days. This was observed by Sumesh_Sol a few weeks ago in case of many breakout scrips. The scrips which create new 52-wk highs, go down a little bit first, to touch even their 13-day moving average and then rise to touch a new high again.
Besides, Cipla's stochastics and RSI are bullish. Let's see what will happen.
|
|
| Back to top |
|
 |
casper
Green Belt

Joined: 02 Oct 2010
Posts: 1315
|
Post: #569  Posted: Thu Dec 02, 2010 11:19 am Post subject: Posted: Thu Dec 02, 2010 11:19 am Post subject: |
 |
|
| pennywise wrote: | Casper,
In case of Cipla, as it has created a new 52-wk yesterday, the price may appreciate further, after initially falling down a little bit in the next few days. This was observed by Sumesh_Sol a few weeks ago in case of many breakout scrips. The scrips which create new 52-wk highs, go down a little bit first, to touch even their 13-day moving average and then rise to touch a new high again.
Besides, Cipla's stochastics and RSI are bullish. Let's see what will happen. |
thank u pennywise,
i hv not seen its reaction at 13ema. in fact its a new idea for me. thanks for it
i have seen it from a point of pattern and ur input shows the strength of t.a
its very true that a same phenomenon can be explained in various methods
and may come to the same conclusion after explaining it in different ways
according to ur posting u can expect it up to 13 ema and as per pattern i can expect it upto 326, as blow 325 should be my positional stop loss as per theory yet both of us are expecting it to zoom
|
|
| Back to top |
|
 |
sumesh_sol
Brown Belt

Joined: 06 Jun 2010
Posts: 2344
|
Post: #570  Posted: Thu Dec 02, 2010 12:40 pm Post subject: HCLTECH Posted: Thu Dec 02, 2010 12:40 pm Post subject: HCLTECH |
 |
|
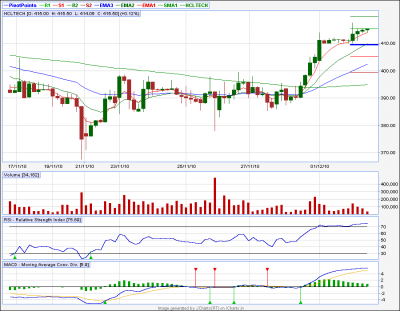
HCLTECH 60tf...
Looks good for 423 above 416 ...
LUPIN(Short) & ChennaliPetro(Long) also did very well...
-Sumesh
| Description: |
|
| Filesize: |
18.62 KB |
| Viewed: |
272 Time(s) |
|
|
|
| Back to top |
|
 |
|
|
You cannot post new topics in this forum
You cannot reply to topics in this forum
You cannot edit your posts in this forum
You cannot delete your posts in this forum
You cannot vote in polls in this forum
You can attach files in this forum
You can download files in this forum
|
Powered by phpBB © 2001, 2005 phpBB Group
|
|
|

