| View previous topic :: View next topic |
| Author |
a layman's approach to break out and break down |
sumesh_sol
Brown Belt

Joined: 06 Jun 2010
Posts: 2344
|
Post: #571  Posted: Thu Dec 02, 2010 1:55 pm Post subject: POWERGRID Posted: Thu Dec 02, 2010 1:55 pm Post subject: POWERGRID |
 |
|
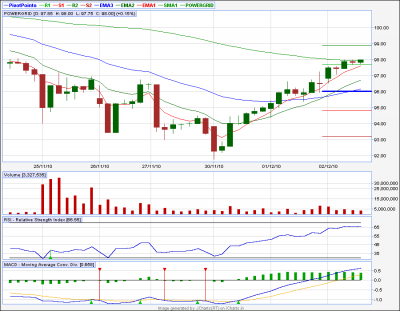
POWERGRID 60TF..
AT for intra... Getting stuck at 89 EMA at 98.. Once breaks this can go high..
I exited HCLtech at 419.8 (long at 416)...
-Sumesh
| Description: |
|
| Filesize: |
18.26 KB |
| Viewed: |
252 Time(s) |
|
|
|
| Back to top |
|
 |
|
|
 |
sumesh_sol
Brown Belt

Joined: 06 Jun 2010
Posts: 2344
|
Post: #572  Posted: Thu Dec 02, 2010 3:20 pm Post subject: Re: POWERGRID Posted: Thu Dec 02, 2010 3:20 pm Post subject: Re: POWERGRID |
 |
|
| sumesh_sol wrote: | POWERGRID 60TF..
AT for intra... Getting stuck at 89 EMA at 98.. Once breaks this can go high..
I exited HCLtech at 419.8 (long at 416)...
-Sumesh |
Powergrid rocked. In fact I shorted Siemens also, but as the target was very small , I didn't post.. that also worked 
Also, I took long in SCI based on nr7+id technique explained by Sherbaaz, that gave me solid result...
Today 100% success & satisfaction Ahhhhhhhh..
-Sumesh
|
|
| Back to top |
|
 |
vrushabh123
White Belt

Joined: 18 Nov 2010
Posts: 39
|
Post: #573  Posted: Thu Dec 02, 2010 3:43 pm Post subject: hiii Posted: Thu Dec 02, 2010 3:43 pm Post subject: hiii |
 |
|
| hello casper.. can pl check Raymond s chart in intra n EOD i cannot find any reason for such a huge run up... i dont know if i m missing anything..pl check n tell any pattern if i missed...
|
|
| Back to top |
|
 |
sinhaalok
White Belt

Joined: 21 Feb 2010
Posts: 15
|
Post: #574  Posted: Thu Dec 02, 2010 7:07 pm Post subject: Posted: Thu Dec 02, 2010 7:07 pm Post subject: |
 |
|
great sumesh.....keep minting... 
|
|
| Back to top |
|
 |
chandrujimrc
Brown Belt

Joined: 21 Apr 2009
Posts: 1683
|
Post: #575  Posted: Thu Dec 02, 2010 8:58 pm Post subject: a laymans" approach to breakout and breakdown Posted: Thu Dec 02, 2010 8:58 pm Post subject: a laymans" approach to breakout and breakdown |
 |
|
Dear casperji,
After breakdown of DT BPCL has formed AT is there any chance to go up.?If yes upto what lvl sir.
chandru.
|
|
| Back to top |
|
 |
chandrujimrc
Brown Belt

Joined: 21 Apr 2009
Posts: 1683
|
Post: #576  Posted: Thu Dec 02, 2010 9:05 pm Post subject: a laymans" approach to breakout and breakdown Posted: Thu Dec 02, 2010 9:05 pm Post subject: a laymans" approach to breakout and breakdown |
 |
|
Dear casperji,
After breakdown of DT BPCL has formed AT is there any chance to go up.?If yes upto what lvl sir.
chandru.
|
|
| Back to top |
|
 |
singh.ravee
Yellow Belt

Joined: 12 Aug 2010
Posts: 678
|
Post: #577  Posted: Thu Dec 02, 2010 9:23 pm Post subject: descending triangle in bharti airtel ?? Posted: Thu Dec 02, 2010 9:23 pm Post subject: descending triangle in bharti airtel ?? |
 |
|
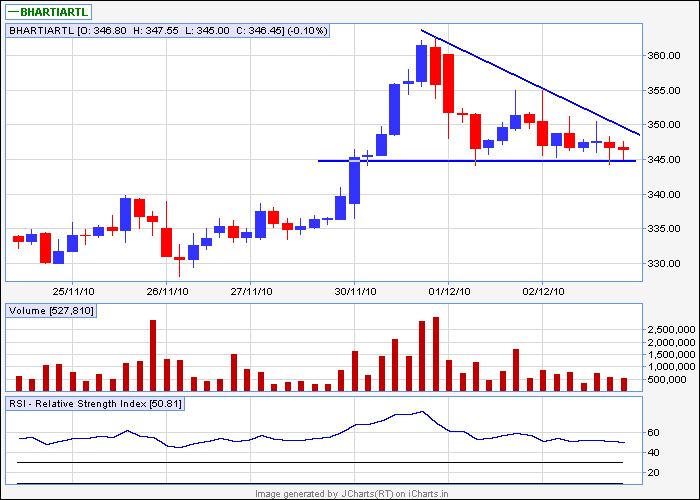
casper bhai,
kindly confirm is it descending triangle in bharti airtel on 60min time frame. If yes, please suggest ur sl and tgt.
rgds
ravee.
| Description: |
|
| Filesize: |
9.39 KB |
| Viewed: |
1059 Time(s) |
|
|
|
| Back to top |
|
 |
mrvishal_g
White Belt

Joined: 17 Sep 2010
Posts: 89
|
Post: #578  Posted: Thu Dec 02, 2010 9:38 pm Post subject: Posted: Thu Dec 02, 2010 9:38 pm Post subject: |
 |
|
Hi Casper,
Please comment on following
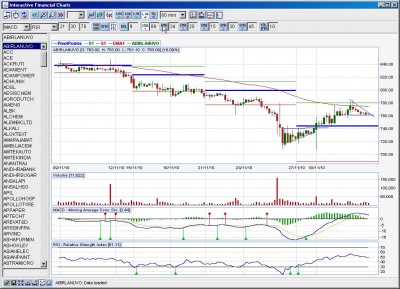
Abirla 762.....RSI and MACD is bullish.
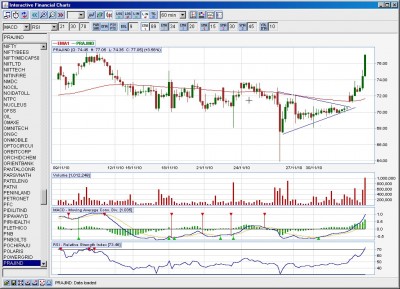
Praj Ind 75.95.....Buy Sl 71.2 Sym. tringle breakout
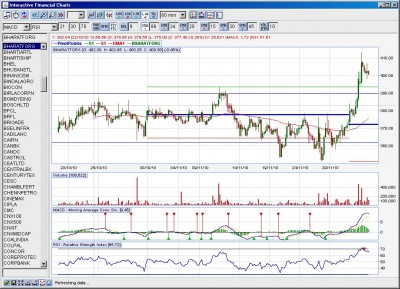
Bharat Forg 401....range breakout yesterday, it reach 413 but not sustain here as per me if we can go long with a sl 395 target may be 425-435 if sustain 400.
Vishal
|
|
| Back to top |
|
 |
casper
Green Belt

Joined: 02 Oct 2010
Posts: 1315
|
Post: #579  Posted: Fri Dec 03, 2010 7:56 am Post subject: Re: hiii Posted: Fri Dec 03, 2010 7:56 am Post subject: Re: hiii |
 |
|
| vrushabh123 wrote: | | hello casper.. can pl check Raymond s chart in intra n EOD i cannot find any reason for such a huge run up... i dont know if i m missing anything..pl check n tell any pattern if i missed... |
me too could not find any thing in the chart
but looks like a morning star candle pattern formed, and that given bullishness but it can not be reason for such huge move
|
|
| Back to top |
|
 |
casper
Green Belt

Joined: 02 Oct 2010
Posts: 1315
|
Post: #580  Posted: Fri Dec 03, 2010 8:03 am Post subject: Re: a laymans" approach to breakout and breakdown Posted: Fri Dec 03, 2010 8:03 am Post subject: Re: a laymans" approach to breakout and breakdown |
 |
|
| chandrujimrc wrote: | Dear casperji,
After breakdown of DT BPCL has formed AT is there any chance to go up.?If yes upto what lvl sir.
chandru. |
hi chandruji
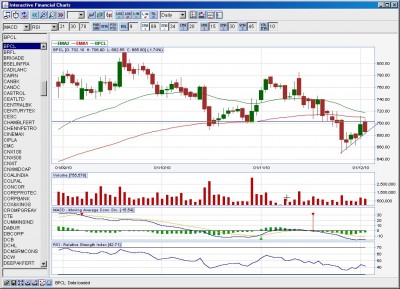
in eod , bpcl has formed a sort of ascending triangle but this may not give us the break out as macd has got a sell signal and rsi too not robust
in order to be a perfect break out case, the macd and rsi should turn bullish first
| Description: |
|
| Filesize: |
191.49 KB |
| Viewed: |
235 Time(s) |
|
|
|
| Back to top |
|
 |
casper
Green Belt

Joined: 02 Oct 2010
Posts: 1315
|
Post: #581  Posted: Fri Dec 03, 2010 8:17 am Post subject: Re: descending triangle in bharti airtel ?? Posted: Fri Dec 03, 2010 8:17 am Post subject: Re: descending triangle in bharti airtel ?? |
 |
|
| singh.ravee wrote: | casper bhai,
kindly confirm is it descending triangle in bharti airtel on 60min time frame. If yes, please suggest ur sl and tgt.
rgds
ravee. |
hi ravee
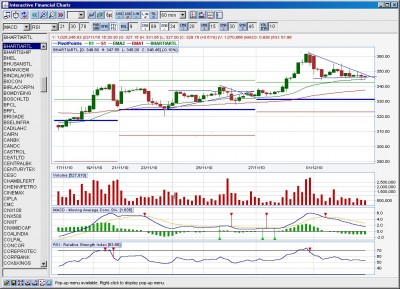
it has very strong support around the lower trend line of the pattern it has weekly r1,and 89 ema both at this level. so down move will be resisted
but once this level is decisively broken it may give us very good downfall
we can short it if weekly r1 is decisively broken by closing basis and target weekly pivot and weekly s1 as our 1st and 2nd target respectively
sl should be a closing above weekly r1 with some coushion
| Description: |
|
| Filesize: |
215.85 KB |
| Viewed: |
249 Time(s) |
|
|
|
| Back to top |
|
 |
singh.ravee
Yellow Belt

Joined: 12 Aug 2010
Posts: 678
|
Post: #582  Posted: Fri Dec 03, 2010 8:43 am Post subject: Posted: Fri Dec 03, 2010 8:43 am Post subject: |
 |
|
Hello Casper,
Thank you so much for your analysis.
I feel if this descending triangle pattern fails, then we can surely go long on bharti.
Also, I have never used pivot points and dont know how to use them also. It would be nice on your part if you can share the same. On 60min time frame do we use weekly pivots? when should we use daily pivots?
Happie trading
rgds
ravee
|
|
| Back to top |
|
 |
casper
Green Belt

Joined: 02 Oct 2010
Posts: 1315
|
Post: #583  Posted: Fri Dec 03, 2010 8:44 am Post subject: Posted: Fri Dec 03, 2010 8:44 am Post subject: |
 |
|
| mrvishal_g wrote: | Hi Casper,
Please comment on following
Abirla 762.....RSI and MACD is bullish.
Praj Ind 75.95.....Buy Sl 71.2 Sym. tringle breakout
Bharat Forg 401....range breakout yesterday, it reach 413 but not sustain here as per me if we can go long with a sl 395 target may be 425-435 if sustain 400.
Vishal |
hi vishal
1. abirlanuvo= dt , macd in buy mode but can give a bearish cross over now.avoid if macd sell signal and break down comes on the sme candle, in that case bd may not sustain
or else, target should be 740
2.prajind= target almost reached. dont consider the long shadow of the red candle, it may trap us as well. if u only consider the real body( because of abnormally long shadow) then target is reached
3.bhart forg= its coming down gradually. expect it it take support at 393 and 390 respectively
dont enter now. wait for the stock to take support at any of these two levels and then with a green candle u can buy it
| Description: |
|
| Filesize: |
194.22 KB |
| Viewed: |
258 Time(s) |
|
| Description: |
|
| Filesize: |
209.58 KB |
| Viewed: |
259 Time(s) |
|
| Description: |
|
| Filesize: |
193.97 KB |
| Viewed: |
247 Time(s) |
|
|
|
| Back to top |
|
 |
casper
Green Belt

Joined: 02 Oct 2010
Posts: 1315
|
Post: #584  Posted: Fri Dec 03, 2010 8:54 am Post subject: Posted: Fri Dec 03, 2010 8:54 am Post subject: |
 |
|
| singh.ravee wrote: | Hello Casper,
Thank you so much for your analysis.
I feel if this descending triangle pattern fails, then we can surely go long on bharti.
Also, I have never used pivot points and dont know how to use them also. It would be nice on your part if you can share the same. On 60min time frame do we use weekly pivots? when should we use daily pivots?
Happie trading
rgds
ravee |
hi ravee
just look at the upper panel of jachrt, u will see a button in the lower row , named "pivpts"
this is the pivot point button, from here u can select monthly/weekly and daily pivots. i just consider the monthly and weekly pivots. dont change the setting. the pivot generated by standard jchart setting will be okey
we have seen that monthly and weekly pivot and r1.s1 are the levels which we can not break on a single hit
it takes multiple hit before its broken and once broken the stock generally gives us very good moves
as of now, i check both the monthly and weekly pivots for checking if there is any support or resistance is in our way or not. so both of them are very important
i dont use daily pivots because that can easily be broken by these triangles
|
|
| Back to top |
|
 |
girishhu1
White Belt

Joined: 17 Aug 2009
Posts: 316
|
Post: #585  Posted: Fri Dec 03, 2010 11:09 am Post subject: Posted: Fri Dec 03, 2010 11:09 am Post subject: |
 |
|
| girishhu1 wrote: | hello casperji,
i m enclosing chart of abg shipyard. if u could read the high tight flag pattern described in 'encyclopedia of chart patterns', you can c all the identification points in this chart also, except that the stock retraced upto 38% instead of 20% prescribed in the book.can u confirm and comment, pl
regards,
girish |
hi casperji,
abg shipyard is in strong uptrend.i am holding call option of 460. target estimated are 550-600. it has easily overcome pivot at 439 and still moving up. after coming out of flag it had given a pullback from 450 to 382 levels.next week target can be achieved.the pattern is described in encyclopedia of chart patterns and similar pattern is under development in alok. kindly check and confirm
regards,
girish 
|
|
| Back to top |
|
 |
|

