|
|
| View previous topic :: View next topic |
| Author |
a layman's approach to break out and break down |
casper
Green Belt

Joined: 02 Oct 2010
Posts: 1315
|
Post: #61  Posted: Fri Oct 29, 2010 10:02 am Post subject: Posted: Fri Oct 29, 2010 10:02 am Post subject: |
 |
|
just forgot to check cumminsind,
open=low=777
made a high of 802 so far
cmp 798
what a mistake from my side!!!
if i saw it earlier....... no point to blame on my luck 
|
|
| Back to top |
|
 |
|
|  |
tripathi_manu
White Belt

Joined: 27 Dec 2008
Posts: 62
|
Post: #62  Posted: Sat Oct 30, 2010 11:16 am Post subject: Posted: Sat Oct 30, 2010 11:16 am Post subject: |
 |
|
| casper wrote: | just forgot to check cumminsind,
open=low=777
made a high of 802 so far
cmp 798
what a mistake from my side!!!
if i saw it earlier....... no point to blame on my luck  |
hi casper, tks for the charts with details . pls suggest how to find and search such scrips which are in such ready way to BO. out of the list there are many names that I have never heard.  do we have such a scanner ? do we have such a scanner ?
regards.
|
|
| Back to top |
|
 |
tripathi_manu
White Belt

Joined: 27 Dec 2008
Posts: 62
|
Post: #63  Posted: Sat Oct 30, 2010 11:36 am Post subject: Posted: Sat Oct 30, 2010 11:36 am Post subject: |
 |
|
| casper wrote: | dh1988 welcome,
rashmi, a consolidated move is seen in mcleodruss from 13th sep onward,
if u refer that, then i think it will take atleast 7-12 days before it makes a perfect symmetrical triangle,
but the point is, today it closed around a support level of 232, it has to maintain the support otherwise the pattern will not complete, so i think its a long way to go,
as far as target's concern, i think the height of base is 35, so the target will be 35 + the bo
according to my "imagination" (i repeat, imagination only) the bo should occur around 240-245 level,so after a successful bo, target will be 245+35=280, but let the pattern form perfectly first  |
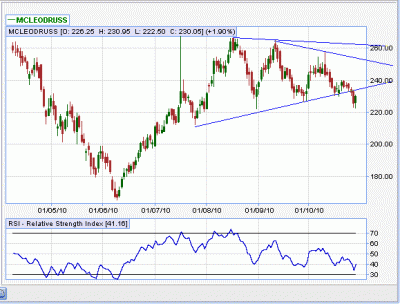
finally there came a break dn only. pls see the chart attached. if the scrip is not in futures we can't make anything out of this move. anyways casper pls suggest wt can be the dn side tgt for the academic purpose.
regards.
manu
| Description: |
|
| Filesize: |
14.34 KB |
| Viewed: |
462 Time(s) |
|
|
|
| Back to top |
|
 |
casper
Green Belt

Joined: 02 Oct 2010
Posts: 1315
|
Post: #64  Posted: Sat Oct 30, 2010 1:34 pm Post subject: Posted: Sat Oct 30, 2010 1:34 pm Post subject: |
 |
|
| tripathi_manu wrote: | | casper wrote: | dh1988 welcome,
rashmi, a consolidated move is seen in mcleodruss from 13th sep onward,
if u refer that, then i think it will take atleast 7-12 days before it makes a perfect symmetrical triangle,
but the point is, today it closed around a support level of 232, it has to maintain the support otherwise the pattern will not complete, so i think its a long way to go,
as far as target's concern, i think the height of base is 35, so the target will be 35 + the bo
according to my "imagination" (i repeat, imagination only) the bo should occur around 240-245 level,so after a successful bo, target will be 245+35=280, but let the pattern form perfectly first  |
finally there came a break dn only. pls see the chart attached. if the scrip is not in futures we can't make anything out of this move. anyways casper pls suggest wt can be the dn side tgt for the academic purpose.
regards.
manu |
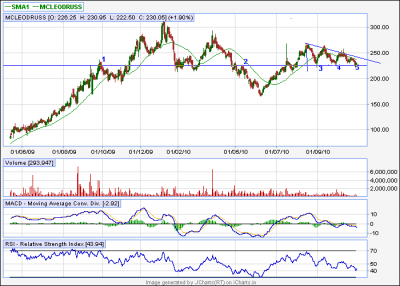
hi manu, im attaching a chart, here u can see a flat trend line has supported the failing price at the current level,
this particular tl has chocked the price move for at lest 5 times.
being time tested and being flat, the trend line is capable of providing enormous strength,so it has choked the down fall at least for now and a green candle at this level may be the signal of a trend reversal
in that case, no down move will be here for now.
but, if the price breach this level with good volume then it would become a case of DESCENDING TRIANGLE.
in that case, the target would be same as the widest part of the triangle viz 30-35 rupees
| Description: |
|
| Filesize: |
16.95 KB |
| Viewed: |
466 Time(s) |
|
|
|
| Back to top |
|
 |
drsureshbs
White Belt

Joined: 22 Oct 2008
Posts: 58
|
Post: #65  Posted: Sat Oct 30, 2010 1:39 pm Post subject: Posted: Sat Oct 30, 2010 1:39 pm Post subject: |
 |
|
Casper excelent stuff.I think you hav made seection of the stocks made easy for many.But how do u moniter a stock for which intra day charts r not available.
Keep up ur good work
Last edited by drsureshbs on Sat Oct 30, 2010 2:19 pm; edited 1 time in total |
|
| Back to top |
|
 |
casper
Green Belt

Joined: 02 Oct 2010
Posts: 1315
|
Post: #66  Posted: Sat Oct 30, 2010 2:12 pm Post subject: Posted: Sat Oct 30, 2010 2:12 pm Post subject: |
 |
|
| tripathi_manu wrote: | | casper wrote: | just forgot to check cumminsind,
open=low=777
made a high of 802 so far
cmp 798
what a mistake from my side!!!
if i saw it earlier....... no point to blame on my luck  |
hi casper, tks for the charts with details . pls suggest how to find and search such scrips which are in such ready way to BO. out of the list there are many names that I have never heard.  do we have such a scanner ? do we have such a scanner ?
regards. |
yes there is so many names. in a bearish day there is 20-30 scrips and in bullish day it reach well around 100
but the bad news is there is no such screener according to my knowledge.
i hv searched rigorously for at least two weeks but wid no avial.
finally i got a free software from the website of Thomas Bulkowsky's (an internationally noted pattern trader) which could find various triangles, but i dont know why, it never worked on my system
[ I AM SORRY ST SIR/ PT SIR, I DO RESPECT THE STANCE OF ICHART TOWARDS OTHER WEBSITES. AND I AM PROUD THAT I HAVE ACCESS IN THE FORUM BUT STILL I NAMED IT FOR PURELY EDUCATIONAL PURPOSE AND WITH NO COMMERCIAL MOTIVE ]
but u can try it if it works. OTHERWISE, as i do find tradable patterns almost everyday, i will also try to post patterns which may seems useful to me. u can at first use it for paper trading, then when u have confidence, u can trade in real.
in the mean time, as there is no short cut ways to success but practice, so only for practice, u should try to find out tradable charts, and u may post them here if u r not sure, i will do my best to help u.
last but not least, i remember my days when it took almost 2/3 hours rigorous charting to find out useful patterns, but with practice now it takes around 30-45 min to go through all the mentioned scrips. if u practice it, then u will also learn to do it fast
just dont try to pick up round bottom/ cup& handle like patterns if u r not a long term investor, restrict ur self to ascending triangle and symmetrical triangle only, try to find 1/2 pattern, in fact for trading we dont need more,
u will be just in and out if u stick to the guide lines of pattern descriptions
if u find some thing which falls under the guide lines the go with it, if not dont try to pull it by force within the description.
after some practice, im sure that THE CHART WILL WHISPER ITS STORY IN UR EARS (NO JOKE) 
|
|
| Back to top |
|
 |
casper
Green Belt

Joined: 02 Oct 2010
Posts: 1315
|
Post: #67  Posted: Sat Oct 30, 2010 2:32 pm Post subject: Posted: Sat Oct 30, 2010 2:32 pm Post subject: |
 |
|
| drsureshbs wrote: | Casper excelent stuff.I think you hav made seection of the stocks made easy for many.But how do u moniter a stock for which intra day charts r not available.
Keep up ur good work |
hi dr sureshbs, thanks for encouragements
there is no ways except yahoo chart. but then , we will miss the tremendous useful ICHART LEVELS.
in that case fibo +pivot level helps a lot.
u can find the fibo and pivot calculator in the calculator option, whenever u see a price in fibo is more or less same with pivot, u just expect huge sup/resi there.
its a make shift approach, but works well
|
|
| Back to top |
|
 |
newinvestor
White Belt

Joined: 16 Feb 2010
Posts: 120
|
Post: #68  Posted: Sat Oct 30, 2010 7:40 pm Post subject: Posted: Sat Oct 30, 2010 7:40 pm Post subject: |
 |
|
Sorry , was too busy to write.
On Friday, I tried following your picks, and CUB, Provogue and Cummins were Open = low. Another one had open=low for quite sometime and then started falling.
Do you keep a trailing stoploss to lock in whatever profits come ?
The strategy is very good, but the bad market did not help.
Do you use reverse startegy for intraday shorting?
|
|
| Back to top |
|
 |
casper
Green Belt

Joined: 02 Oct 2010
Posts: 1315
|
Post: #69  Posted: Sat Oct 30, 2010 8:13 pm Post subject: Posted: Sat Oct 30, 2010 8:13 pm Post subject: |
 |
|
welcome back newinvestor 
generally i dont use trailing stop because bo scrips tends to be much more volatile and at any instance of time, sl may get hit and then stock will zoom.
i maintain a sl just below the open=low and try to book as soon as i feel good.
if i get the intraday chart then only i follow trailing stop, in this case suppose a break out pattern is forming in REAL TIME CHART, i would verify it 5 min,10min,15 min and 30 min to see if the pattern is valid for higher time frame also.
then i would find a point which if breached will make the pattern null and void (so that the reason to trade the stock also become invalid) and would use that point in 30 min tf(time frame) as my 1st sl, whn price goes up, i will change it to 15 min tf corresponding point as my 2nd sl and so on, ranging from higher to lower
but generally i never changed my sl more than twice in a trade as i generally get my desired profit by then.
and i do use this strategy for intraday shorts also.
this setuo works well in a trending market or even in choppy market.
but only during trend reversal it creates trouble, im working to find a suitable solution in case of trend reversal, but as of now, i dont hv any answer to trend reversal 
|
|
| Back to top |
|
 |
mrvishal_g
White Belt

Joined: 17 Sep 2010
Posts: 89
|
Post: #70  Posted: Sat Oct 30, 2010 8:14 pm Post subject: Posted: Sat Oct 30, 2010 8:14 pm Post subject: |
 |
|
Hi Casper,
I find out some stock for monday please comment
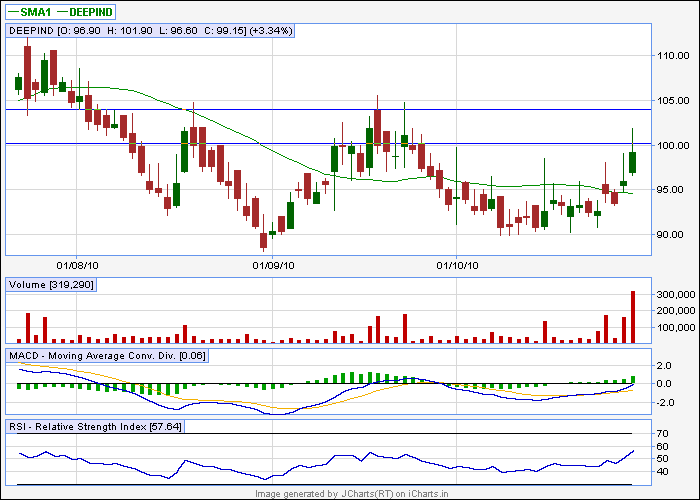
Deep Ind 99--------Buy T-105-110
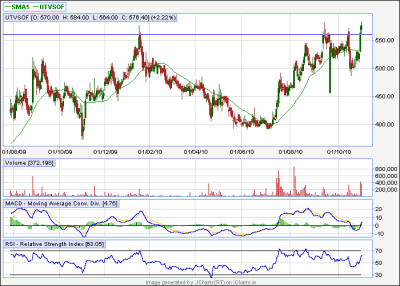
UTV 576-------Buy T-600
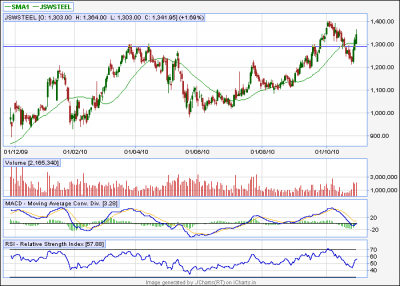
JSW Steel 1342---------Buy Target 1400, 1450(positional buy)
as per me buy call will trigger only if stock will be in white candle in first few mintunes(5 min) and sl will be near open price.
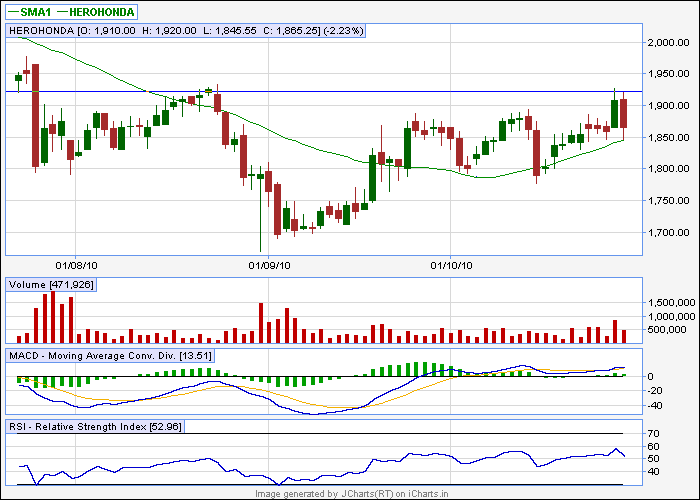
I find Herohonda (1865) a buy candidate
above 1925 T-2050
near 1810 T-1850
or if open with gap up.
|
|
| Back to top |
|
 |
mrvishal_g
White Belt

Joined: 17 Sep 2010
Posts: 89
|
Post: #71  Posted: Sat Oct 30, 2010 8:24 pm Post subject: Posted: Sat Oct 30, 2010 8:24 pm Post subject: |
 |
|
Hi Casper,
I checked EOD charts on charts (as u told me, thanks for it) but found charts only apx 3 monts, is there any chance to see it for a longer period.
|
|
| Back to top |
|
 |
casper
Green Belt

Joined: 02 Oct 2010
Posts: 1315
|
Post: #72  Posted: Sat Oct 30, 2010 9:12 pm Post subject: Posted: Sat Oct 30, 2010 9:12 pm Post subject: |
 |
|
hi mrvishal_g,
here is what i understood from ur calls 
all patterns are round bottom or cup and handle, nice finding
hero honda: u may target around 2100 if it sustain above 1925
deepind:i would suggest u to buy at 100 insted of 99 as 99 is the zone where bo should occur, so we have to buy after the bo, or else, the stock may go for consolidation. target is alri8
utvsof: target 650 after 600 is achieved, as the distance from bo to the bottom is aprox 150 so the target will be bo + distance= 500+150=600
jswsteel: same goes for jsw, target here 1500+ if 1450 is taken out
im attaching the charts
in jcharts eod, use the magnifying glass tool situated at the top left corner to increase or decrease the time span, it will be decresed if u zoom in, and will increase if u zoom out
in chart(premium) link where u can get flash charts but can to use tool, u will see a drop down menu at the top left corner , from here u can select the time span,
u can get all the data available, starting from listing the company
| Description: |
|
| Filesize: |
10.16 KB |
| Viewed: |
2264 Time(s) |
|
| Description: |
|
| Filesize: |
10.65 KB |
| Viewed: |
2264 Time(s) |
|
| Description: |
|
| Filesize: |
15.71 KB |
| Viewed: |
472 Time(s) |
|
| Description: |
|
| Filesize: |
16.46 KB |
| Viewed: |
481 Time(s) |
|
|
|
| Back to top |
|
 |
newinvestor
White Belt

Joined: 16 Feb 2010
Posts: 120
|
Post: #73  Posted: Sat Oct 30, 2010 9:58 pm Post subject: Posted: Sat Oct 30, 2010 9:58 pm Post subject: |
 |
|
Casper, just a casual observation.
When I look at the long term charts of NIFTY as well as many stocks, the pattern seems to have completed ( from the top of 2008, then a bottoming out in early 2009, and then the ride back to top 2008 levels.
Now what happens? A breakout or a break down?
This is true for Nifty charts as well as many stocks.
I was just looking at 3 yr chart for Petronet LNG. It seems to have crossed its 2008 high slightly , and raced down with a vengeance. Will we see a similiar show in Nifty and other stocks with similiar pattern?
Also, another concern ( from a technical angle) is that Nifty as well as many stocks are near major support levels, below which there is no support for a long way ( this was the fast run up of the past few weeks, with no pause).
Any comments or tips on how to trade from here?
|
|
| Back to top |
|
 |
casper
Green Belt

Joined: 02 Oct 2010
Posts: 1315
|
Post: #74  Posted: Sat Oct 30, 2010 10:58 pm Post subject: Posted: Sat Oct 30, 2010 10:58 pm Post subject: |
 |
|
it is said that we may be wrong but the market is never wrong.
so we have to depend on the clue from the market.
its true that if we fall from here that will be a devastating one and most of us will never head back to stock market in their life time ever.
we have traveled a long way in a very short span of time, thanks to fii, they could not produce result in their homeland so came here to stretch the valuation here.
according to me,we are not fundamentally strong enough to attain the level where we are currently. if it were not so, then the COAL INDIA ipo, which soaked money considerably from our market, wont gift us a choppy to bearish trend in spite of growth story and "india shining"
now i believe that the answer lies in the current earning session. generally results shows the way and valuation follows. but now,........ as the valuation reached its horizon, its the duty of the results to support the valuation, or else, there will be an asset bubble
just a mention...... every thing is okey, gdp going to progress @ 8% or more but august iip data suddenly slowed a bit. a tiny thing..... but if problem persist, who knows may turn to be a cancer?
but dont panic, just follow the market, we are traders, we will follow the market and survive 
|
|
| Back to top |
|
 |
girishhu1
White Belt

Joined: 17 Aug 2009
Posts: 316
|
Post: #75  Posted: Sun Oct 31, 2010 10:40 am Post subject: Posted: Sun Oct 31, 2010 10:40 am Post subject: |
 |
|
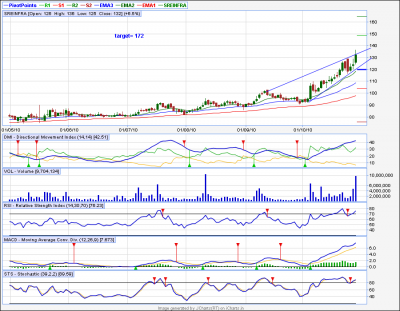
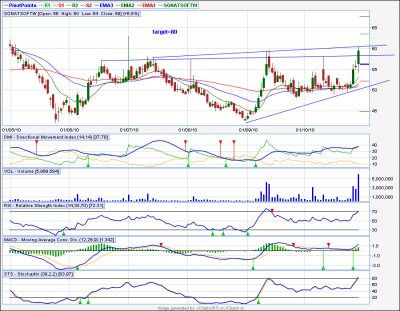
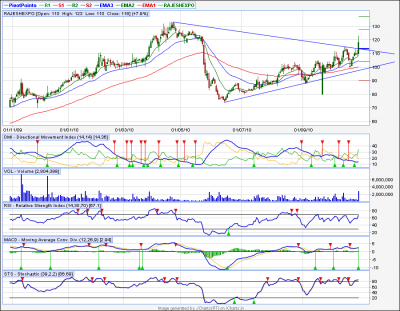
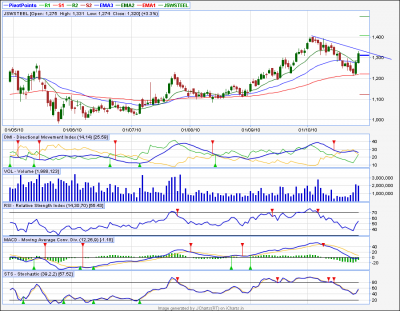
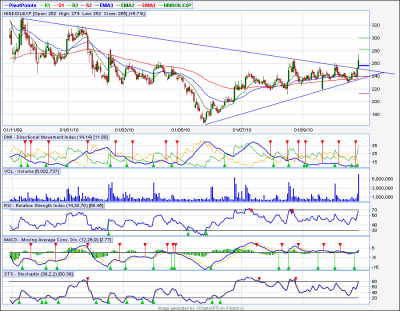
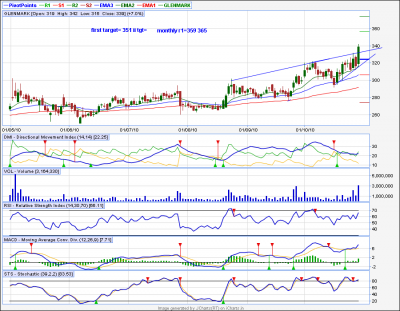
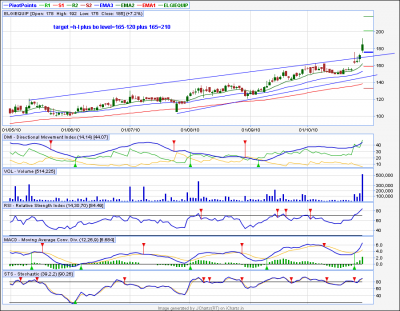
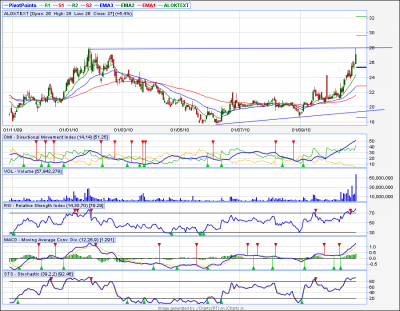
i m enclosing 5-7 charts. will u comment on them please?
| Description: |
|
| Filesize: |
48.1 KB |
| Viewed: |
478 Time(s) |
|
| Description: |
|
| Filesize: |
56.17 KB |
| Viewed: |
493 Time(s) |
|
| Description: |
|
| Filesize: |
61.57 KB |
| Viewed: |
483 Time(s) |
|
| Description: |
|
| Filesize: |
53.26 KB |
| Viewed: |
465 Time(s) |
|
| Description: |
|
| Filesize: |
70.86 KB |
| Viewed: |
453 Time(s) |
|
| Description: |
|
| Filesize: |
55.56 KB |
| Viewed: |
455 Time(s) |
|
| Description: |
|
| Filesize: |
54.27 KB |
| Viewed: |
481 Time(s) |
|
| Description: |
|
| Filesize: |
60.78 KB |
| Viewed: |
478 Time(s) |
|
|
|
| Back to top |
|
 |
|
|
You cannot post new topics in this forum
You cannot reply to topics in this forum
You cannot edit your posts in this forum
You cannot delete your posts in this forum
You cannot vote in polls in this forum
You can attach files in this forum
You can download files in this forum
|
Powered by phpBB © 2001, 2005 phpBB Group
|
|
|

