|
|
| View previous topic :: View next topic |
| Author |
a layman's approach to break out and break down |
casper
Green Belt

Joined: 02 Oct 2010
Posts: 1315
|
Post: #601  Posted: Sat Dec 04, 2010 12:43 pm Post subject: Re: hii casper.. Posted: Sat Dec 04, 2010 12:43 pm Post subject: Re: hii casper.. |
 |
|
| girishhu1 wrote: | | casper wrote: | | vrushabh123 wrote: | i just saw ur post for ABG n ALOK...its a diff type of flad na..can u pl explain abt it also how to calculate tgt for it.. In EOD for ALOK its a small flag formed but every candle higher than the previous..u to know abt it..n u talked abt some encyclopedia...is it on icharts or some other site..pl tell wanna read too..it will be of great help...
THANKS... |
1. for calculating a flag or pennant target u have to draw a line from the top part of the pattern up to the immediate resistance/support it has broken,
its known a s flag pole
then u have to project the flag pole form break out or break down point
that should be ur rough target. plz see the aloke chart i posted for girish bhaiya for an example
2.the encyclopedia we are talking abot is a book written by thomas bulkowasky . he is an international "guru" of pattern trading,
his personal home page is http://www.thepatternsite.com/
his book is available for free(!!!!!!!) in various sites which i cant not name here 
in fact i wrote about his site only after st sir's permission in which he wrote to vishy tht pattern site link is okey. or else i wont dare to post this link also 
anyway, his site also contains various informations about the patterns and if u want to get a free copy(????!!!!) of his book then just search it in google |
hi casperji/vrushabh,
just a little additional info.
htf discovered by o;neil.
first condition for this pattern is stock should have moved up by 100% in last months.
casperji, pl note the rule for fixing targets.
measure the rise leading to the flag and project half of it upward, using the flag low.
this is one of the most reliable patterns having failure rate less than 10% and avg rise about > 69%. and rated no 1among all patterns by bulkowsky.
other details can be found on sites.
regards,
girish |
thank u girish bhaiyaa
i have read about it from the website again. u know as i trade on intraday and try to find at/dt mostly i need to revise about other patterns otherwise i will forget about them
i have read tht for target projection, ur method is the classical method prescribed by bulkowsky. i,on the other hand used it wrongly, as i used the flag pole in full instead of using it in half, but may be due to the general
bullishness of the market, i achieved target some how
so now on i will use the flag pole in half and not in full. thank u once agin 
|
|
| Back to top |
|
 |
|
|  |
sumesh_sol
Brown Belt

Joined: 06 Jun 2010
Posts: 2344
|
Post: #602  Posted: Sat Dec 04, 2010 1:29 pm Post subject: Re: GPIL Target and Dena Bank Posted: Sat Dec 04, 2010 1:29 pm Post subject: Re: GPIL Target and Dena Bank |
 |
|
| spurt wrote: | Hi Sumesh,
Thanks ! How did you calculate the target for 2-3 of 210 can you please help explain thanks.
Can you check the Dena Bank,, I believe its showing a downtrend. |
Hello Spurt,
There are two things:
1.) First is target of 210, which I arrived at by two logics, it is Monthly R1 and secondly I calculated the max. distance during the formation of AT formation (touching points).
2.) Second is time frame. I said 2-3 days based on "momentum of the market", as there is no hard and fast rule for target time frame. If the market shows bullishness, the target can even be achieved in a single day ! However, I'm more optimistic as there was more than 100% increase in volume as compared to last 10 days volume.
Let's wait & watch, how it goes. But first and foremost, it has to break the resistance..
-Sumesh
|
|
| Back to top |
|
 |
girishhu1
White Belt

Joined: 17 Aug 2009
Posts: 316
|
Post: #603  Posted: Sat Dec 04, 2010 7:55 pm Post subject: Re: hii casper.. Posted: Sat Dec 04, 2010 7:55 pm Post subject: Re: hii casper.. |
 |
|
| casper wrote: | | girishhu1 wrote: | | casper wrote: | | vrushabh123 wrote: | i just saw ur post for ABG n ALOK...its a diff type of flad na..can u pl explain abt it also how to calculate tgt for it.. In EOD for ALOK its a small flag formed but every candle higher than the previous..u to know abt it..n u talked abt some encyclopedia...is it on icharts or some other site..pl tell wanna read too..it will be of great help...
THANKS... |
1. for calculating a flag or pennant target u have to draw a line from the top part of the pattern up to the immediate resistance/support it has broken,
its known a s flag pole
then u have to project the flag pole form break out or break down point
that should be ur rough target. plz see the aloke chart i posted for girish bhaiya for an example
2.the encyclopedia we are talking abot is a book written by thomas bulkowasky . he is an international "guru" of pattern trading,
his personal home page is http://www.thepatternsite.com/
his book is available for free(!!!!!!!) in various sites which i cant not name here 
in fact i wrote about his site only after st sir's permission in which he wrote to vishy tht pattern site link is okey. or else i wont dare to post this link also 
anyway, his site also contains various informations about the patterns and if u want to get a free copy(????!!!!) of his book then just search it in google |
hi casperji/vrushabh,
just a little additional info.
htf discovered by o'neil.
first condition for this pattern is stock should have moved up by 100% in last 2 months.
casperji, pl note the rule for fixing targets for htf.
measure the rise leading to the flag and project half of it upward, using the flag low.
this is one of the most reliable patterns having failure rate less than 10% and avg rise about > 69%. and rated no 1among all patterns by bulkowsky.
other details can be found on sites.
regards,
girish |
thank u girish bhaiyaa
i have read about it from the website again. u know as i trade on intraday and try to find at/dt mostly i need to revise about other patterns otherwise i will forget about them
i have read tht for target projection, ur method is the classical method prescribed by bulkowsky. i,on the other hand used it wrongly, as i used the flag pole in full instead of using it in half, but may be due to the general
bullishness of the market, i achieved target some how
so now on i will use the flag pole in half and not in full. thank u once agin  |
hellow casperji,
u r not wrong . for normal flags the rule is same ie. half distance but for high , tight flag,(HTF) wherein the stock should have moved more than 100 % in past 2 months, the rule i posted is applicable.
regards,
girish
Last edited by girishhu1 on Sun Dec 05, 2010 3:53 pm; edited 1 time in total |
|
| Back to top |
|
 |
vrushabh123
White Belt

Joined: 18 Nov 2010
Posts: 39
|
Post: #604  Posted: Sun Dec 05, 2010 12:16 pm Post subject: Thanks.. Posted: Sun Dec 05, 2010 12:16 pm Post subject: Thanks.. |
 |
|
Thanks a lot casper and girishbhaiya for sharing ur views...i will surely search for tht book...it will be of great help..
I m already learning lot from u... Thanks a lot.... 
|
|
| Back to top |
|
 |
ragarwal
Yellow Belt

Joined: 16 Nov 2008
Posts: 582
|
Post: #605  Posted: Sun Dec 05, 2010 12:30 pm Post subject: Posted: Sun Dec 05, 2010 12:30 pm Post subject: |
 |
|
| thnx casper,i shud get out near my buy price in gspl i think.thnx once again
|
|
| Back to top |
|
 |
ragarwal
Yellow Belt

Joined: 16 Nov 2008
Posts: 582
|
Post: #606  Posted: Sun Dec 05, 2010 1:54 pm Post subject: Posted: Sun Dec 05, 2010 1:54 pm Post subject: |
 |
|
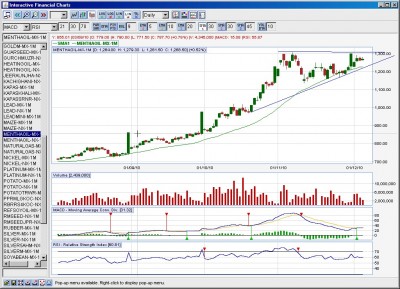
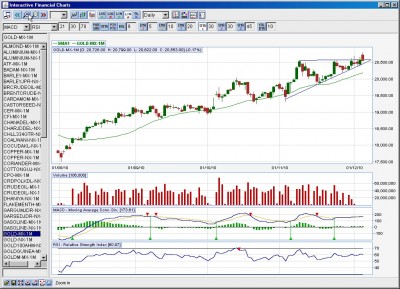
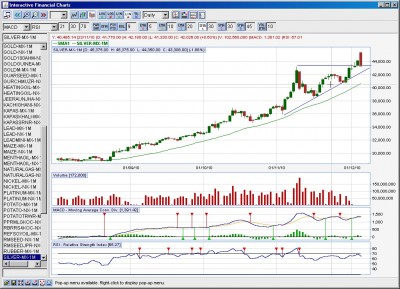
hey casper ,do u track commodities too.cn u plz look up silver,gold and mentha.mentha seems a triangle has broken out ,the trget being roughly 165rs,bo point is 1200.fr silver it seems to hv broken out fr a fairly large upmove,mayb of 5500 rs.plz guide me.gold too seems to hv broken out fr a trget of 1000rs frm 20500,plz giv ur views if possible.
thnx
|
|
| Back to top |
|
 |
casper
Green Belt

Joined: 02 Oct 2010
Posts: 1315
|
Post: #607  Posted: Sun Dec 05, 2010 10:07 pm Post subject: Posted: Sun Dec 05, 2010 10:07 pm Post subject: |
 |
|
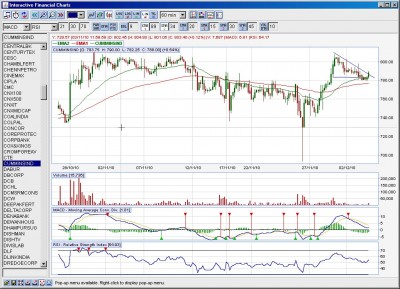
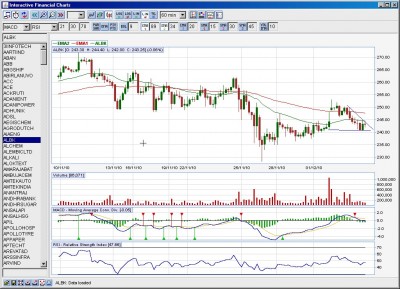
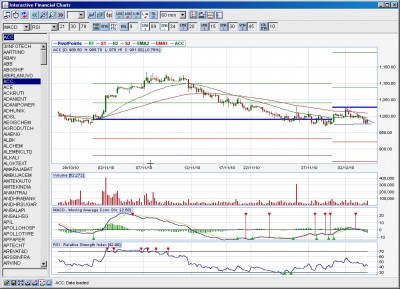
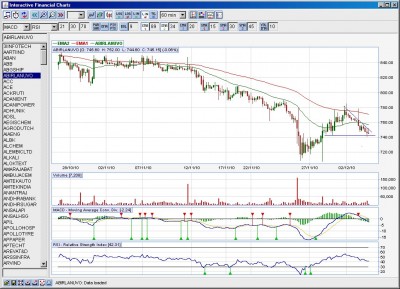
finally it seems to me that we are at the threshold of a new series of event. next week has the potential to direct our future course for at least a short term basis, it has the power to make the market or to break the market. its a time which will be very volatile, bull and bear will fight to the death and as nobody wants to die easily so the fighting will be fierce i guess, whomever wins, he will rule for a new high or new low
in such a situation i would have avoided to post any calls as i dont know where will we open. the levels i am writing will ever come in action or not, believe me i never felt so shaky from inside, because i know that most of us who follow this thread so keenly are novice traders like me, if the things turn wrong we the novice peoples will get killed at first. but then i thought its better to try to put some light on what may be just ahead of us, than sitting silently and die. like my many other initiatives, vishy (vishy.tns) and rakesh (measoldier) are behind of what i am going to post now, we have passed the whole of weekend on these recommendations and tried to see its pros and cons
finally we agreed that being very volatile, this market may give us some excellent opportunity to earn as a trader, so i came here to waste my as well as ur time 
now let us jump to the calls, but one last thing to mention, plz only enter these trades with a valid break out/break down, always refer to monthly pivots, r1r2/s1s2 levels and 89/34 ema for entry, exit and sl purpose and trade with strict stop loss. A SMALL LOSS WILL SAVE US FROM BIG LOSS
i could not consider the weekly levels as we are on the weekend and tomorrow only we will get the fresh weekly levels, but u plz dont forget about them also
1. abirlanuvo= dt, it has support of lower tl +pivot at 740. sell with a bd of this level. target 700 aprx
2.acc= sell below 980 and book around 940
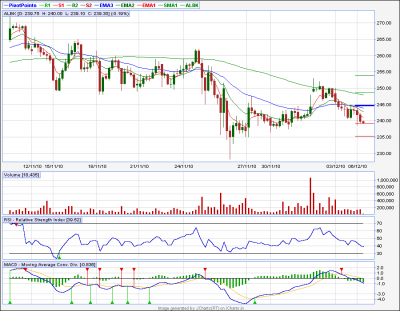
3.albk= sell below 240 target 230
4.cumminsind= its dt. has support from 89/34 ema also, sell with a bd from 780 level but let both ema break 1st. target 765,760
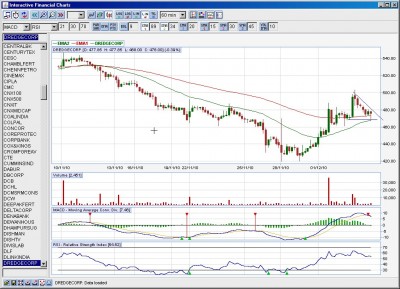
5.dredgecorp=it has very strong support at the current level, sell only with bd around 470 level and book it 450-440 level
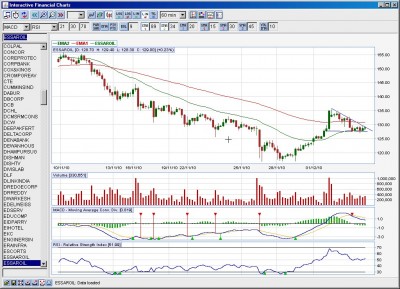
6.essaroil= dt. target 125.120
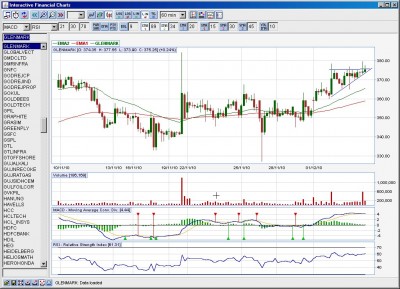
7.glenmark= ascending triangle, buy above 375 and target 382, 390,400
8.wipro= at.target 440
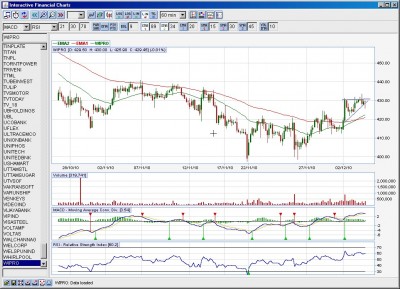
.
for every descending triangle, my stop loss will be a candle close above the breaking down level and for every ascending triangle my stop loss is a candle closing below break out level
| Description: |
|
| Filesize: |
196.27 KB |
| Viewed: |
257 Time(s) |
|
| Description: |
|
| Filesize: |
191.57 KB |
| Viewed: |
256 Time(s) |
|
| Description: |
|
| Filesize: |
201.81 KB |
| Viewed: |
281 Time(s) |
|
| Description: |
|
| Filesize: |
193.64 KB |
| Viewed: |
234 Time(s) |
|
| Description: |
|
| Filesize: |
211.33 KB |
| Viewed: |
264 Time(s) |
|
| Description: |
|
| Filesize: |
199.22 KB |
| Viewed: |
255 Time(s) |
|
| Description: |
|
| Filesize: |
197.75 KB |
| Viewed: |
253 Time(s) |
|
| Description: |
|
| Filesize: |
194.68 KB |
| Viewed: |
261 Time(s) |
|
|
|
| Back to top |
|
 |
casper
Green Belt

Joined: 02 Oct 2010
Posts: 1315
|
Post: #608  Posted: Sun Dec 05, 2010 10:11 pm Post subject: Posted: Sun Dec 05, 2010 10:11 pm Post subject: |
 |
|
| ragarwal wrote: | hey casper ,do u track commodities too.cn u plz look up silver,gold and mentha.mentha seems a triangle has broken out ,the trget being roughly 165rs,bo point is 1200.fr silver it seems to hv broken out fr a fairly large upmove,mayb of 5500 rs.plz guide me.gold too seems to hv broken out fr a trget of 1000rs frm 20500,plz giv ur views if possible.
thnx |
sorry rashmi, i have seen it too late, now after my dinner i will start working on them, though i dont trade commodities myself but lets see if we could find something on chart or not
i may post my finding at late night or at worst condition, tomorrow morning, plz wait
|
|
| Back to top |
|
 |
casper
Green Belt

Joined: 02 Oct 2010
Posts: 1315
|
Post: #609  Posted: Sun Dec 05, 2010 11:30 pm Post subject: Posted: Sun Dec 05, 2010 11:30 pm Post subject: |
 |
|
| ragarwal wrote: | hey casper ,do u track commodities too.cn u plz look up silver,gold and mentha.mentha seems a triangle has broken out ,the trget being roughly 165rs,bo point is 1200.fr silver it seems to hv broken out fr a fairly large upmove,mayb of 5500 rs.plz guide me.gold too seems to hv broken out fr a trget of 1000rs frm 20500,plz giv ur views if possible.
thnx |
hi rashmi, u r right, all these seems to be ascending triangle but actual bo has not occur
im explaining one by one (i hv checked the mx version of the commodities only)
1.gold= if price stays above 20557 with good volume then only we can expect a huge up move, target will be 21000,21500
2.silver= price broken out but retraced back to the bo level. it needs to stay above 43407, but here also low volume is a concern.
target should be 48000
3.mentha= enter here strictly after bo above 1300, target 1500. the corresponding rsi shows strong negative divergence,so an actual break out is needed before we can take a position
| Description: |
|
| Filesize: |
208.87 KB |
| Viewed: |
233 Time(s) |
|
| Description: |
|
| Filesize: |
200.74 KB |
| Viewed: |
271 Time(s) |
|
| Description: |
|
| Filesize: |
209.14 KB |
| Viewed: |
235 Time(s) |
|
|
|
| Back to top |
|
 |
yawalkar
White Belt

Joined: 02 Oct 2010
Posts: 58
|
Post: #610  Posted: Mon Dec 06, 2010 7:58 am Post subject: Posted: Mon Dec 06, 2010 7:58 am Post subject: |
 |
|
casper,
i noticed in your chart MACD, RSI, 21,30,70 is showing in left side. But in my charts it is not. Do you have any other settings?
I want to make a default setting for macd, rsi, & volume. But i need to make it manually for each stock. Can u explain how to make it default?
|
|
| Back to top |
|
 |
casper
Green Belt

Joined: 02 Oct 2010
Posts: 1315
|
Post: #611  Posted: Mon Dec 06, 2010 8:17 am Post subject: Posted: Mon Dec 06, 2010 8:17 am Post subject: |
 |
|
| yawalkar wrote: | casper,
i noticed in your chart MACD, RSI, 21,30,70 is showing in left side. But in my charts it is not. Do you have any other settings?
I want to make a default setting for macd, rsi, & volume. But i need to make it manually for each stock. Can u explain how to make it default? |
i could not understand the problem clearly as i never faced such situation. i get the default setting whenever i open.
for rsi setting is 21/30/70
and for macd setting 12/26/9
u do one thing, just manually set the parameter then click the FOLPPY BUTTON situated at the lower end of the symbol entry form to the left hand side, it will save the setting as default
and after saving the setting this way. immediately click the open preferrance button just left to the floppy button to load and enable the setting u choose for default.
this way u can choose and save any indicator setting
|
|
| Back to top |
|
 |
ragarwal
Yellow Belt

Joined: 16 Nov 2008
Posts: 582
|
Post: #612  Posted: Mon Dec 06, 2010 9:05 am Post subject: Posted: Mon Dec 06, 2010 9:05 am Post subject: |
 |
|
| thnx casper fr d early reply.in mentha macd hs given a buy though d negativ divergence is there.how do v interpret this
|
|
| Back to top |
|
 |
ragarwal
Yellow Belt

Joined: 16 Nov 2008
Posts: 582
|
Post: #613  Posted: Mon Dec 06, 2010 9:08 am Post subject: Posted: Mon Dec 06, 2010 9:08 am Post subject: |
 |
|
| also in coppe cn v expect firewrks above 400 if it sustains
|
|
| Back to top |
|
 |
sumesh_sol
Brown Belt

Joined: 06 Jun 2010
Posts: 2344
|
Post: #614  Posted: Mon Dec 06, 2010 11:16 am Post subject: BHEL Posted: Mon Dec 06, 2010 11:16 am Post subject: BHEL |
 |
|
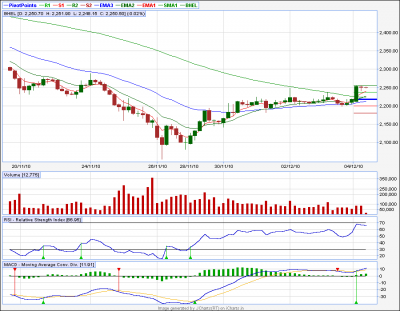
BHEL .. 60TF..
Looking good for upside...
| Description: |
|
| Filesize: |
19.16 KB |
| Viewed: |
253 Time(s) |
|
|
|
| Back to top |
|
 |
sumesh_sol
Brown Belt

Joined: 06 Jun 2010
Posts: 2344
|
Post: #615  Posted: Mon Dec 06, 2010 11:18 am Post subject: ALBK 60tf Posted: Mon Dec 06, 2010 11:18 am Post subject: ALBK 60tf |
 |
|
ALBK
Looking good for downside..
| Description: |
|
| Filesize: |
23.33 KB |
| Viewed: |
264 Time(s) |
|
|
|
| Back to top |
|
 |
|
|
You cannot post new topics in this forum
You cannot reply to topics in this forum
You cannot edit your posts in this forum
You cannot delete your posts in this forum
You cannot vote in polls in this forum
You can attach files in this forum
You can download files in this forum
|
Powered by phpBB © 2001, 2005 phpBB Group
|
|
|

