| View previous topic :: View next topic |
| Author |
a layman's approach to break out and break down |
sumesh_sol
Brown Belt

Joined: 06 Jun 2010
Posts: 2344
|
Post: #616  Posted: Mon Dec 06, 2010 2:27 pm Post subject: DABUR .. 60tf Posted: Mon Dec 06, 2010 2:27 pm Post subject: DABUR .. 60tf |
 |
|
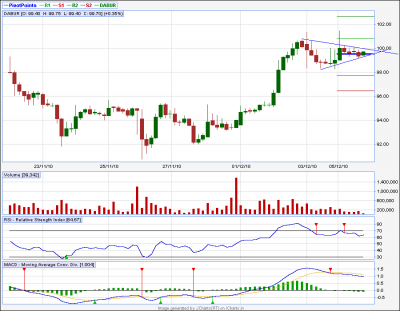
Though this type of pattern can go any side,there are high chances that it goes downwards seeing MACD and RSI values...take your call...
| Description: |
|
| Filesize: |
16.07 KB |
| Viewed: |
252 Time(s) |
|
|
|
| Back to top |
|
 |
|
|
 |
sumesh_sol
Brown Belt

Joined: 06 Jun 2010
Posts: 2344
|
Post: #617  Posted: Mon Dec 06, 2010 7:32 pm Post subject: Posted: Mon Dec 06, 2010 7:32 pm Post subject: |
 |
|
Today's Result
DABUR & Albk (Short) : Picture Perfect Intra short worked
BHEL(Long) : It was a damp squib.. didn't take off much... exited at small profit.
I did two more successful shorts(ICICIBank/RECLtd) , but as they were not very good looking setups, I didn't post....
I will appreciate if othersalso post charts DURING mkt hours, very difficult for one person to hunt for good setups... (of course casper does but I want more from him during mkt hrs.... ) 
Cheers
-Sumesh
|
|
| Back to top |
|
 |
casper
Green Belt

Joined: 02 Oct 2010
Posts: 1315
|
Post: #618  Posted: Mon Dec 06, 2010 8:31 pm Post subject: Posted: Mon Dec 06, 2010 8:31 pm Post subject: |
 |
|
| ragarwal wrote: | | thnx casper fr d early reply.in mentha macd hs given a buy though d negativ divergence is there.how do v interpret this |
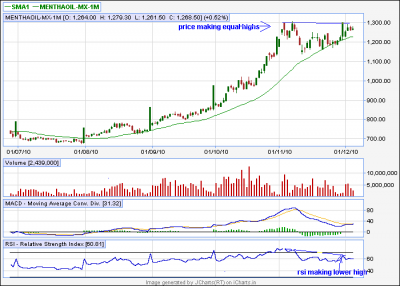
in case of mentha, we see two equal highs in price but the corresponding rsi has made a lower high.
means rsi is telling u that during the second high, the power of bulls were lower than the case of previous high.
that means, during the making of 2nd high, the bear regained some strength and he is trying to overpower the bull
and if it continues then bear will not allow the bull to make a come back in near term. so price will go down for sure
lets concentrate on what i wrote, i wrote enter here only after an actual break out, means, when we could make another high above these two highs or bo what ever u call it, then it will be case of higher high, in that case this big, bad , bear will go for winter vacation and mr bull will keep on charging
and very quickly let us take a look upon some facts of macd and rsi
macd is lagging indicator. it follows the price, and is derived from the moving average, so macd has its limitation for prediction, while rsi is classified as a momentum oscillator, measuring the velocity and magnitude of directional price movements.momentum is the rate of the rise or fall in price. the rsi computes momentum as the ratio of higher closes to lower closes: stocks which have had more or stronger positive changes have a higher rsi than stocks which have had more or stronger negative changes.
so its it sort of early warning sysem
we have to incorporate both of them in our trading, the rsi should be supporting or or at least neutral to the macd reading if we want to enter before an actual bo
if rsi is against the macd, just like mentha case, then we will have to wait for the actual break down
| Description: |
|
| Filesize: |
12.4 KB |
| Viewed: |
243 Time(s) |
|
|
|
| Back to top |
|
 |
casper
Green Belt

Joined: 02 Oct 2010
Posts: 1315
|
Post: #619  Posted: Mon Dec 06, 2010 8:32 pm Post subject: Posted: Mon Dec 06, 2010 8:32 pm Post subject: |
 |
|
| sumesh_sol wrote: | Today's Result
DABUR & Albk (Short) : Picture Perfect Intra short worked
BHEL(Long) : It was a damp squib.. didn't take off much... exited at small profit.
I did two more successful shorts(ICICIBank/RECLtd) , but as they were not very good looking setups, I didn't post....
I will appreciate if othersalso post charts DURING mkt hours, very difficult for one person to hunt for good setups... (of course casper does but I want more from him during mkt hrs.... ) 
Cheers
-Sumesh |
ok sumesh, noted 
|
|
| Back to top |
|
 |
casper
Green Belt

Joined: 02 Oct 2010
Posts: 1315
|
Post: #620  Posted: Mon Dec 06, 2010 8:37 pm Post subject: Posted: Mon Dec 06, 2010 8:37 pm Post subject: |
 |
|
| ragarwal wrote: | | also in coppe cn v expect firewrks above 400 if it sustains |
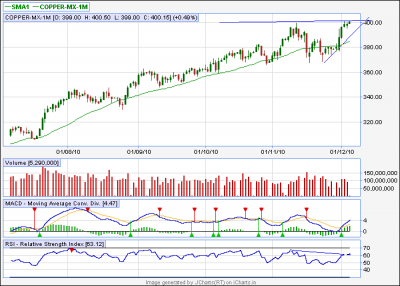
here also divergence is seen, vol is also not supporting, so wait for an actual bo above 400, target 420.430
| Description: |
|
| Filesize: |
13.11 KB |
| Viewed: |
243 Time(s) |
|
|
|
| Back to top |
|
 |
sumesh_sol
Brown Belt

Joined: 06 Jun 2010
Posts: 2344
|
Post: #621  Posted: Tue Dec 07, 2010 9:55 am Post subject: HDIL .. 60 tf. Posted: Tue Dec 07, 2010 9:55 am Post subject: HDIL .. 60 tf. |
 |
|
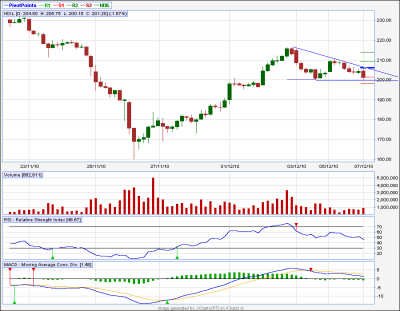
HDIL.. DT in formation..
I will short it below 197 for a target of 190 & 185.
-Sumesh
| Description: |
|
| Filesize: |
15.61 KB |
| Viewed: |
240 Time(s) |
|
|
|
| Back to top |
|
 |
vrushabh123
White Belt

Joined: 18 Nov 2010
Posts: 39
|
Post: #622  Posted: Tue Dec 07, 2010 10:24 am Post subject: hii sumesh & casper Posted: Tue Dec 07, 2010 10:24 am Post subject: hii sumesh & casper |
 |
|
| Also track SRF it is on crucial pivot of 364 if breaks can go to 352..hope i m right .. pl correct if not..
|
|
| Back to top |
|
 |
ragarwal
Yellow Belt

Joined: 16 Nov 2008
Posts: 582
|
Post: #623  Posted: Tue Dec 07, 2010 10:41 am Post subject: Posted: Tue Dec 07, 2010 10:41 am Post subject: |
 |
|
| dear casper,thnx a lot.u were very ryt about mentha it is down to 1237 today.wat cn b a gud entry point,n peax explain the whys n hows of it:)
|
|
| Back to top |
|
 |
casper
Green Belt

Joined: 02 Oct 2010
Posts: 1315
|
Post: #624  Posted: Tue Dec 07, 2010 10:49 am Post subject: Posted: Tue Dec 07, 2010 10:49 am Post subject: |
 |
|
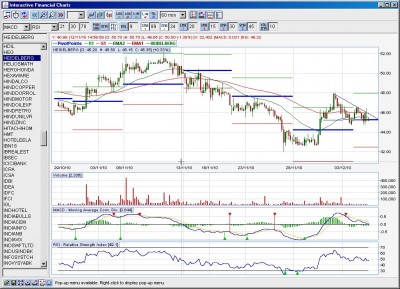
short heidelberg when the bd occur
target 3 rupees
| Description: |
|
| Filesize: |
211.99 KB |
| Viewed: |
234 Time(s) |
|
|
|
| Back to top |
|
 |
casper
Green Belt

Joined: 02 Oct 2010
Posts: 1315
|
Post: #625  Posted: Tue Dec 07, 2010 11:02 am Post subject: Posted: Tue Dec 07, 2010 11:02 am Post subject: |
 |
|
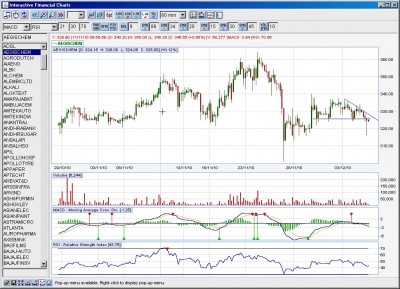
aegischem
dt or on larger scale , h/s
enter with a bd here, target 310,(already alomost touched and went up, so need to short agin if it does not close above the pivot/lower tl)
| Description: |
|
| Filesize: |
200.4 KB |
| Viewed: |
224 Time(s) |
|
|
|
| Back to top |
|
 |
sumesh_sol
Brown Belt

Joined: 06 Jun 2010
Posts: 2344
|
Post: #626  Posted: Tue Dec 07, 2010 11:14 am Post subject: ARVIND Posted: Tue Dec 07, 2010 11:14 am Post subject: ARVIND |
 |
|
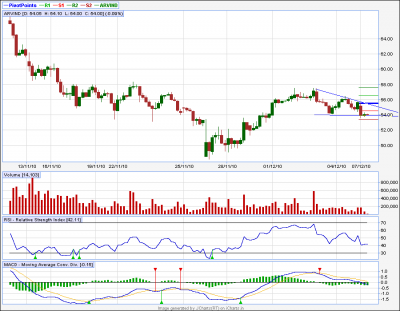
Arvind .. 60tf
DT..
Breakdown below 53.3 can take it to 52.3 & 51..
-Sumesh
| Description: |
|
| Filesize: |
18.54 KB |
| Viewed: |
231 Time(s) |
|
|
|
| Back to top |
|
 |
casper
Green Belt

Joined: 02 Oct 2010
Posts: 1315
|
Post: #627  Posted: Tue Dec 07, 2010 11:35 am Post subject: Re: hii sumesh & casper Posted: Tue Dec 07, 2010 11:35 am Post subject: Re: hii sumesh & casper |
 |
|
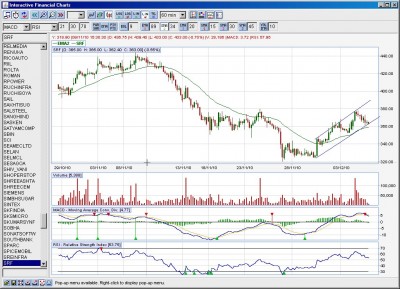
| vrushabh123 wrote: | | Also track SRF it is on crucial pivot of 364 if breaks can go to 352..hope i m right .. pl correct if not.. |
srf is in strong support zone, and its not any triangle, its more of a channel.
sell only if the lower tl of the pattern breaks down or else, it has 89/34 ema support near by so will go up or may become choppy
| Description: |
|
| Filesize: |
202.82 KB |
| Viewed: |
222 Time(s) |
|
|
|
| Back to top |
|
 |
casper
Green Belt

Joined: 02 Oct 2010
Posts: 1315
|
Post: #628  Posted: Tue Dec 07, 2010 11:37 am Post subject: Posted: Tue Dec 07, 2010 11:37 am Post subject: |
 |
|
| ragarwal wrote: | | dear casper,thnx a lot.u were very ryt about mentha it is down to 1237 today.wat cn b a gud entry point,n peax explain the whys n hows of it:) |
plz wait a while . will post when get a lil time 
|
|
| Back to top |
|
 |
casper
Green Belt

Joined: 02 Oct 2010
Posts: 1315
|
Post: #629  Posted: Tue Dec 07, 2010 11:42 am Post subject: Posted: Tue Dec 07, 2010 11:42 am Post subject: |
 |
|
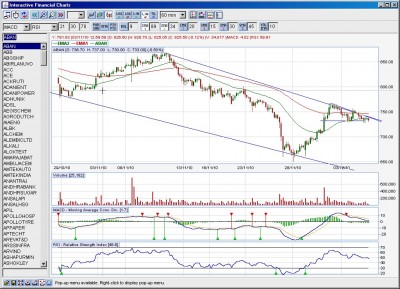
aban. dt
sell with a bd, a level of support is 716, pivot support
then virtually no support is seen for along downward journey
but enter with bd only
| Description: |
|
| Filesize: |
209.81 KB |
| Viewed: |
237 Time(s) |
|
|
|
| Back to top |
|
 |
casper
Green Belt

Joined: 02 Oct 2010
Posts: 1315
|
Post: #630  Posted: Tue Dec 07, 2010 1:17 pm Post subject: Posted: Tue Dec 07, 2010 1:17 pm Post subject: |
 |
|
| casper wrote: | | ragarwal wrote: | | dear casper,thnx a lot.u were very ryt about mentha it is down to 1237 today.wat cn b a gud entry point,n peax explain the whys n hows of it:) |
plz wait a while . will post when get a lil time  |
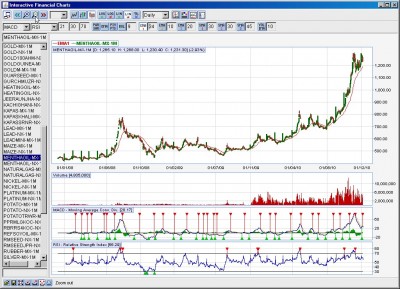
rashmi download the following chart and see it in larger format, if u have ms photo editor/fax viewer or paint brush software it will be easy for u
this chart has 34 ema plotted
just see from 2008 when ever mentha took support at this 34 ema , it has made a strong come back and only after breaching 34, it has gone down. but as its in long term uptrend so correction was not severe
now let it come down it 34 ema, and watch if it takes support form here or goes down strongly
if it takes support then, with a green candle u can start buying
now watch for macd buy signal and check corresponding rsi, the rsi should be very oversold or even may start heading upward, that will be the ideal condition to buy more. even its ok with a flat or neutral rsi but avoid buying
if the rsi is going down when macd is in buy mode, in that case wait either for rsi to stabilize or wait for another high in price
| Description: |
|
| Filesize: |
211.7 KB |
| Viewed: |
253 Time(s) |
|
|
|
| Back to top |
|
 |
|

