|
|
| View previous topic :: View next topic |
| Author |
a layman's approach to break out and break down |
ravionlinek
White Belt

Joined: 11 Jun 2010
Posts: 97
|
Post: #676  Posted: Fri Dec 10, 2010 9:57 am Post subject: Posted: Fri Dec 10, 2010 9:57 am Post subject: |
 |
|
Hello casper
G.M
chek out BO On Tata Steel On 5 min Chart
|
|
| Back to top |
|
 |
|
|  |
deepakms
White Belt

Joined: 13 Aug 2009
Posts: 194
|
Post: #677  Posted: Fri Dec 10, 2010 10:29 am Post subject: Posted: Fri Dec 10, 2010 10:29 am Post subject: |
 |
|
Hi Casper,
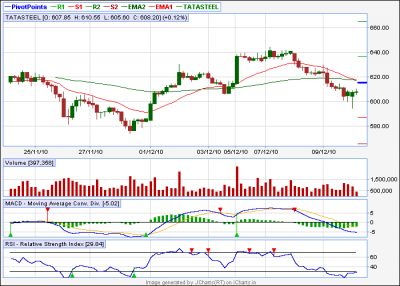
Since I have started trying to do what you and Sumesh do....trying my luck here.Tata steel on a 60tf needs to cross over 616 approx to begin a upward move.
Pls correct me..............I should enter a long trade only then.
Rgds
Deeppak
| Description: |
|
| Filesize: |
12.71 KB |
| Viewed: |
257 Time(s) |
|
|
|
| Back to top |
|
 |
casper
Green Belt

Joined: 02 Oct 2010
Posts: 1315
|
Post: #678  Posted: Fri Dec 10, 2010 10:50 am Post subject: Posted: Fri Dec 10, 2010 10:50 am Post subject: |
 |
|
| ravionlinek wrote: | Hello casper
G.M
chek out BO On Tata Steel On 5 min Chart |
in 5 min tf. 89 ema is present at 611.43 level now, u can buy only above it. or 89 ema will chock the movement
|
|
| Back to top |
|
 |
ravionlinek
White Belt

Joined: 11 Jun 2010
Posts: 97
|
Post: #679  Posted: Fri Dec 10, 2010 10:55 am Post subject: Posted: Fri Dec 10, 2010 10:55 am Post subject: |
 |
|
| casper wrote: | | ravionlinek wrote: | Hello casper
G.M
chek out BO On Tata Steel On 5 min Chart |
in 5 min tf. 89 ema is present at 611.43 level now, u can buy only above it. or 89 ema will chock the movement |
................................................................................................................
ok
|
|
| Back to top |
|
 |
casper
Green Belt

Joined: 02 Oct 2010
Posts: 1315
|
Post: #680  Posted: Fri Dec 10, 2010 10:55 am Post subject: Posted: Fri Dec 10, 2010 10:55 am Post subject: |
 |
|
| deepakms wrote: | Hi Casper,
Since I have started trying to do what you and Sumesh do....trying my luck here.Tata steel on a 60tf needs to cross over 616 approx to begin a upward move.
Pls correct me..............I should enter a long trade only then.
Rgds
Deeppak |
though in 60 min tf no particular pattern is seen but if a 60 min tf candle closes above both the emas u can buy
or else, buy now as the price is above pivot and a candle close below pivot should be stop loss and both the ema near 620 as ur 1st target
thouh both pivots are at same level, but for sl use monthly pivot
|
|
| Back to top |
|
 |
girishhu1
White Belt

Joined: 17 Aug 2009
Posts: 316
|
Post: #681  Posted: Fri Dec 10, 2010 12:57 pm Post subject: Posted: Fri Dec 10, 2010 12:57 pm Post subject: |
 |
|
hello casperji,
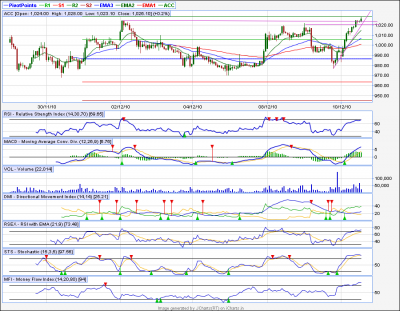
at breakout in acc in 15m tf kindly confirm.
regards,
girish
| Description: |
|
| Filesize: |
56.31 KB |
| Viewed: |
302 Time(s) |
|
|
|
| Back to top |
|
 |
casper
Green Belt

Joined: 02 Oct 2010
Posts: 1315
|
Post: #682  Posted: Fri Dec 10, 2010 1:44 pm Post subject: Posted: Fri Dec 10, 2010 1:44 pm Post subject: |
 |
|
yes girish bhaiya it was a bo. price seems to retracing to the bo level
sorry hv not seen ur post as i was offline,
today no 60 min tf is seen so far so not trading 
|
|
| Back to top |
|
 |
mrvishal_g
White Belt

Joined: 17 Sep 2010
Posts: 89
|
Post: #683  Posted: Sat Dec 11, 2010 8:52 am Post subject: Posted: Sat Dec 11, 2010 8:52 am Post subject: |
 |
|
| casper wrote: | hi vishal
jbf to mila nehi, but as per nitco,it has taken support at 68 level. it has 89 ema support also, below this target is 63 as the lower bb is present there. so plz wait to see its reaction at 89ema, if it takes support from here it can go up or consolidate and if its breached then we can expect 63 levels today
again on eod chart, a sort of dt is forming whose lower tl is 68. so if this 68 level is broken decisively then we can expect good down move where 63 would become a support and if breached the stock will tank more |
Hi Casper,
JBF up by 6.5% yesterday. It is also available on icharts code is JBFInd for your kind information.
Vishal
|
|
| Back to top |
|
 |
sumesh_sol
Brown Belt

Joined: 06 Jun 2010
Posts: 2344
|
Post: #684  Posted: Sat Dec 11, 2010 11:53 am Post subject: Re: JINDALSTEL Posted: Sat Dec 11, 2010 11:53 am Post subject: Re: JINDALSTEL |
 |
|
| mrvishal_g wrote: | | sumesh_sol wrote: | JINDALSTEL on 60tf...
Before I leave, I could find one good trade opportunity. You guys can see it tomorrow(I'll be on leave  ).. Below 880 we can target 860 safely ..(The BD has already taken place).. ).. Below 880 we can target 860 safely ..(The BD has already taken place)..
All the best.
CASPER: Yes, my dear friend our relentless efforts are paying fruits.. Now I feel even more confident. Actually day trade is all about "Conviction". From your conviction comes patience and courage. This is all one requires in day trade ! Earlier I used to get impatient and panic with market movements, Now with God blessings, I feel more clear in my approach.
I hope and sincerly pray all of us should make good profit in coming days. I appeal everyone to come forward and post more and more charts in this series...
Cheers,
Sumesh |
Helloooooooo, Jindalstel rate is 679.95 while you write below 880 target 860 i think you wrongly type 8 instead of 6 or i m looking some wrong stock., pl clarify......................Vishal |
Hi Vishal,
I'm on vacation attending a family function. Today I could access some net time, and here I saw your message !
First of all my apology, it was 680/660 and not 880/860 for Jindalstel.
Secondly, before entering any trade based on candle close till last day, it is always adviseable to wait for some time say 15-30 mns to see if the setup still holds, because every new day's opening is affected by many factors. As you can see within first 5 mns. , Jindalstel changed it gear because the broad market was in upswing..
If you have not traded then no problem at all, but if u have entered then please keep a strict SL of 704 (LTP 697).. In fact if mkt opens as flat to negative, then try shorting near 700 and exit fully near 690.. But this is only to reduce your losses... Not at all recommended as fresh trade .. !!
Regards,
Sumesh
|
|
| Back to top |
|
 |
sumesh_sol
Brown Belt

Joined: 06 Jun 2010
Posts: 2344
|
Post: #685  Posted: Sat Dec 11, 2010 12:17 pm Post subject: IFCI Posted: Sat Dec 11, 2010 12:17 pm Post subject: IFCI |
 |
|
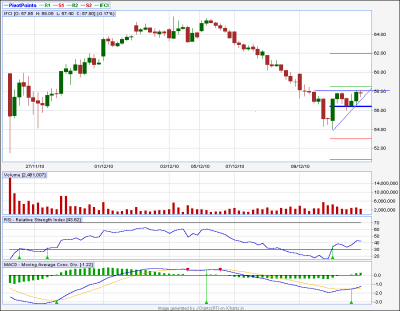
IFCI.. on 60tf
***************
One more good looking setup , while I'm on vacation 
IFCI took support on 54 and is on pull back.. the AT is well supported by rising RSI and MACD, both has buy signals...
LTP is 57.8 .. target is near 62.. But please wait for 15-30 min. before entering. If mkt opens flat to positive or after opening -ve starts trading abv ydays's high then only buy above BO. You may miss the bus by waiting, but will not bear loss. It is sort of insurance premium u r paying !
Every day you will find few very good setups, keep hunting for good looking patterns..
One more advice, although it is better to wait for the target, but always be on vigil, if u find stock getting stuck in between getting resistance, better to book partially.. Afterall its your money and u must take care of it..
See you friends, hope I will be able to get some time off again sometimes...
-Regards,
Sumesh
| Description: |
|
| Filesize: |
15.84 KB |
| Viewed: |
311 Time(s) |
|
|
|
| Back to top |
|
 |
singh.ravee
Yellow Belt

Joined: 12 Aug 2010
Posts: 678
|
Post: #686  Posted: Sun Dec 12, 2010 1:17 pm Post subject: Posted: Sun Dec 12, 2010 1:17 pm Post subject: |
 |
|
casper,
Hello,
I wish to learn from you regarding the parameters for macd oscillator. Also, are these parameter universal for all time frames
thanks and regards
ravee
|
|
| Back to top |
|
 |
casper
Green Belt

Joined: 02 Oct 2010
Posts: 1315
|
Post: #687  Posted: Sun Dec 12, 2010 3:35 pm Post subject: Posted: Sun Dec 12, 2010 3:35 pm Post subject: |
 |
|
hi ravee
though i have tested various 'real time' time frames but i seriously traded and trading only on 5 min and 60 min tf
(now as u r reading st sir's past post, im sure u can guess why i traded in 5 min in past  ) )
and i found the standard jchart basic setting of macd(12/26/9) produces satisfactory and dependable signals, depending on which we can initiate trades
for our intraday bo/bd methods we follow the macd generated buy/sell signal to get a confirmation about the validity of the bo/bd
but one thing which we have observed during our trading that if macd gives the buy signal only on the bo candle or gives sell signals only on the bd candle then the bo/bd turns false
we need macd to generate buy/sell signal before actual bo/bd, and if it turns to favorable only on the bo/bd candle then we fail to get result of the bo/bd
so for me, macd setting of 12/26/9 is universal for every tf
|
|
| Back to top |
|
 |
mrvishal_g
White Belt

Joined: 17 Sep 2010
Posts: 89
|
Post: #688  Posted: Sun Dec 12, 2010 6:37 pm Post subject: Posted: Sun Dec 12, 2010 6:37 pm Post subject: |
 |
|
Hi Sumesh,
Please don't use the word "apology". We are friends and giving call on the basis of technical analysis. We all now that no method is 100% correct. We all trying to learn more and earing money with learing.
I just traded 50 shares and booked loss of apx 500.
i traded 1000 nitco and earn 2800 so no loss on friday.
Keep going on and giving your wonderful calls and forgot exceptions which is everywhere.
Thanks for IFCI call
Vishal
|
|
| Back to top |
|
 |
mrvishal_g
White Belt

Joined: 17 Sep 2010
Posts: 89
|
Post: #689  Posted: Sun Dec 12, 2010 7:32 pm Post subject: Posted: Sun Dec 12, 2010 7:32 pm Post subject: |
 |
|
Hi Casper,
Please comment on following
Allahabad Bank 207.95
Axisbank 1323.55
Dlf 284
ICICI 1121
as per me these all are buy candidate for Monday with a sl of open -1%
Vishal   
|
|
| Back to top |
|
 |
casper
Green Belt

Joined: 02 Oct 2010
Posts: 1315
|
Post: #690  Posted: Sun Dec 12, 2010 8:39 pm Post subject: Posted: Sun Dec 12, 2010 8:39 pm Post subject: |
 |
|
| mrvishal_g wrote: | Hi Casper,
Please comment on following
Allahabad Bank 207.95
Axisbank 1323.55
Dlf 284
ICICI 1121
as per me these all are buy candidate for Monday with a sl of open -1%
Vishal    |
hi vishal
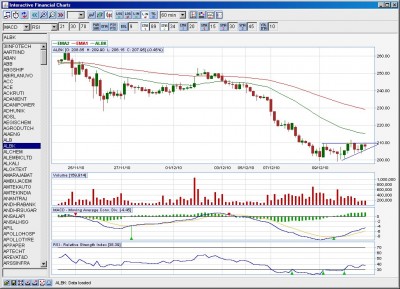
1. albk in 60 min tf, it has formed an at, with macd and rsi in buy mode.we can buy above 210 with the bo and target 214 (34ema) and 220(monthly s2) as our intra day targets
this stock, as per eod chart has a zone of resistance form 230-245 above which we can expect 260-275
2.axisbank has no impresive set up in real time chart, but is has successfully broken out of 34 ema and sustained above it, if it sustain this, then we can get 1350.1400 in intraday.
as per eod chart, it has formed a morning star pattern which can successfully reverse its down trend. as per eod chart we will face resistance at 1411,1425 range, above which we can expect 1500 levels
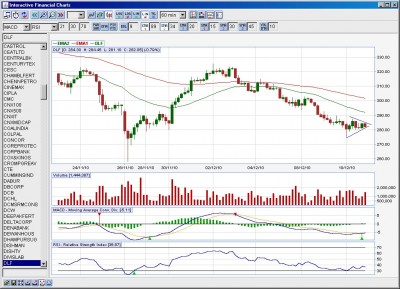
3.dlf has formed a sort of sym. tri but we have resistance at 292 and 302 range,( 34 and 89 ema respectively) wait for price to stay above 284. it will confirm the bo
in eod it has touched the lower bb at 277 level,so we can expect some respite from here, if it respects the lower bb then it will also form a double bottom reversal which will increase its strength
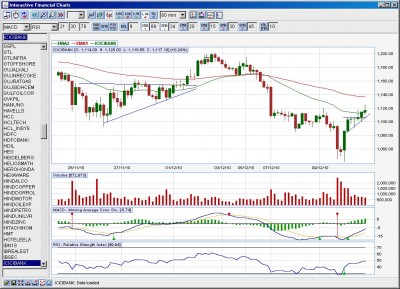
4.icicibank formed an at and broken out and closed above 34 ema , if it holds then we can expect 1140 on intraday
on eod if it sustain above 1140 then we can target 1190 and 1250 in coming days
the iip data is already factored in the cmp, we dont know wht will be the impact of chine rate rise so plz be cautious and dont hesitate to send an sos if u caught on wrong foot, i know u can not watch market thats why im mentioning it 
| Description: |
|
| Filesize: |
201.2 KB |
| Viewed: |
261 Time(s) |
|
| Description: |
|
| Filesize: |
192.65 KB |
| Viewed: |
268 Time(s) |
|
| Description: |
|
| Filesize: |
195.26 KB |
| Viewed: |
254 Time(s) |
|
|
|
| Back to top |
|
 |
|
|
You cannot post new topics in this forum
You cannot reply to topics in this forum
You cannot edit your posts in this forum
You cannot delete your posts in this forum
You cannot vote in polls in this forum
You can attach files in this forum
You can download files in this forum
|
Powered by phpBB © 2001, 2005 phpBB Group
|
|
|

