| View previous topic :: View next topic |
| Author |
a layman's approach to break out and break down |
Allwell
White Belt

Joined: 24 Jan 2010
Posts: 183
|
Post: #691  Posted: Sun Dec 12, 2010 9:04 pm Post subject: Posted: Sun Dec 12, 2010 9:04 pm Post subject: |
 |
|
Hellow Casper Sir,
Confused on view of Axis Bank. to me 34 EMA should be 1411. correct me if I am wrong...
Thanks and regards...
|
|
| Back to top |
|
 |
|
|
 |
casper
Green Belt

Joined: 02 Oct 2010
Posts: 1315
|
Post: #692  Posted: Sun Dec 12, 2010 10:40 pm Post subject: Posted: Sun Dec 12, 2010 10:40 pm Post subject: |
 |
|
| dijyya wrote: | Hellow Casper Sir,
Confused on view of Axis Bank. to me 34 EMA should be 1411. correct me if I am wrong...
Thanks and regards... |
hi dijyya
in case of axis bank eod the 34 ema is 1411 as mentioned by u, (thats why i put it as my eod target)
but in real time chart 60 min tf, which i follow for trading, 34 ema is 1313.77 roughly, and the last candle is just above it
as i use 60 min tf so when i write any ema of real time chart or any bo/bd level. plz refer to 60min chart always.if i need to refer any other tf, then i will mention the tf as ema and set ups varies heavily with the tf 
|
|
| Back to top |
|
 |
Allwell
White Belt

Joined: 24 Jan 2010
Posts: 183
|
Post: #693  Posted: Sun Dec 12, 2010 10:53 pm Post subject: Posted: Sun Dec 12, 2010 10:53 pm Post subject: |
 |
|
| thanks Casper Sir
|
|
| Back to top |
|
 |
singh.ravee
Yellow Belt

Joined: 12 Aug 2010
Posts: 678
|
Post: #694  Posted: Mon Dec 13, 2010 8:16 am Post subject: Posted: Mon Dec 13, 2010 8:16 am Post subject: |
 |
|
Good Morning Casper,
Thank u so much for your timely reply. Have a wonderful trading day ahead
rgds
ravee
|
|
| Back to top |
|
 |
casper
Green Belt

Joined: 02 Oct 2010
Posts: 1315
|
Post: #695  Posted: Mon Dec 13, 2010 8:20 am Post subject: Posted: Mon Dec 13, 2010 8:20 am Post subject: |
 |
|
| singh.ravee wrote: | Good Morning Casper,
Thank u so much for your timely reply. Have a wonderful trading day ahead
rgds
ravee |
good morning ravee, thanks and welcome. wish u a happy trading day bro 
|
|
| Back to top |
|
 |
casper
Green Belt

Joined: 02 Oct 2010
Posts: 1315
|
Post: #696  Posted: Mon Dec 13, 2010 8:41 am Post subject: Posted: Mon Dec 13, 2010 8:41 am Post subject: |
 |
|
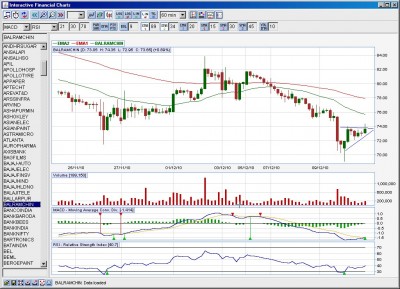
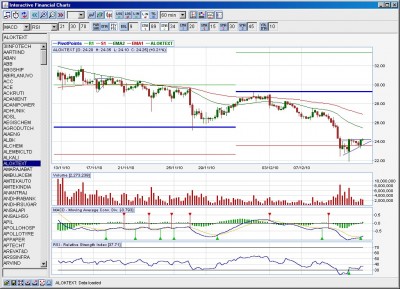
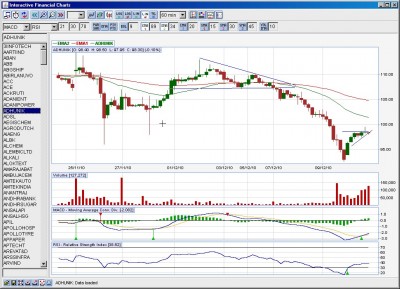
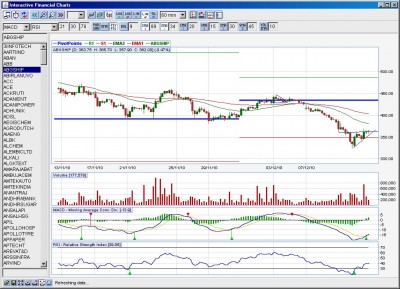
a few strong set ups, among them, albk is already mentioned. im posting the remaining, we need to enter with a bo and then a candle close below the bo level will serve as our stop loss, all set ups are of 60 min tf
1.abgship= target 380.400
2.adhunik=target 101
3.aloktext=target 25.25,26
4.balramchin=target 76
| Description: |
|
| Filesize: |
197.73 KB |
| Viewed: |
284 Time(s) |
|
| Description: |
|
| Filesize: |
201.67 KB |
| Viewed: |
275 Time(s) |
|
| Description: |
|
| Filesize: |
185.1 KB |
| Viewed: |
289 Time(s) |
|
| Description: |
|
| Filesize: |
200.71 KB |
| Viewed: |
290 Time(s) |
|
|
|
| Back to top |
|
 |
ravionlinek
White Belt

Joined: 11 Jun 2010
Posts: 97
|
Post: #697  Posted: Mon Dec 13, 2010 10:33 am Post subject: JPassocait Posted: Mon Dec 13, 2010 10:33 am Post subject: JPassocait |
 |
|
Casper
chek out JPassociat For BO 60 Min TF
|
|
| Back to top |
|
 |
thegani
White Belt

Joined: 03 Nov 2010
Posts: 21
|
Post: #698  Posted: Mon Dec 13, 2010 10:40 am Post subject: Posted: Mon Dec 13, 2010 10:40 am Post subject: |
 |
|
hi casper ji kaha tha na 375 ke uper cipla ko close honedo.
jane do please tell me ke icharts me stock compare kaise kare
thanx
|
|
| Back to top |
|
 |
casper
Green Belt

Joined: 02 Oct 2010
Posts: 1315
|
Post: #699  Posted: Mon Dec 13, 2010 10:55 am Post subject: Re: JPassocait Posted: Mon Dec 13, 2010 10:55 am Post subject: Re: JPassocait |
 |
|
| ravionlinek wrote: | Casper
chek out JPassociat For BO 60 Min TF |
ravi wait for a candle close above 107.20, that will confirm the bo
be aware. veeru sir posted that a fall may come between 11.15-11.50 am, plz watch out and once in profit, trail ur stops
|
|
| Back to top |
|
 |
casper
Green Belt

Joined: 02 Oct 2010
Posts: 1315
|
|
| Back to top |
|
 |
casper
Green Belt

Joined: 02 Oct 2010
Posts: 1315
|
Post: #701  Posted: Mon Dec 13, 2010 7:36 pm Post subject: Posted: Mon Dec 13, 2010 7:36 pm Post subject: |
 |
|
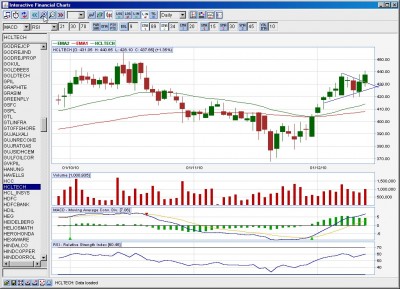
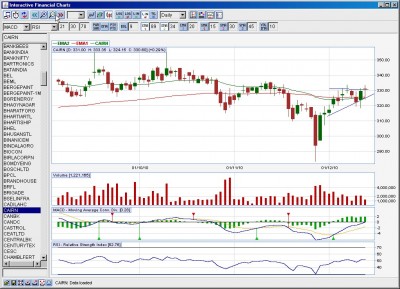
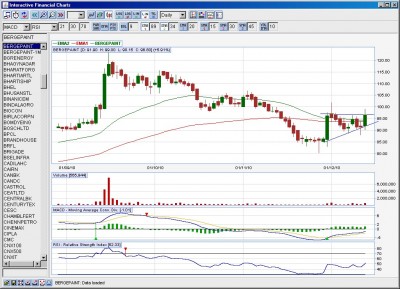
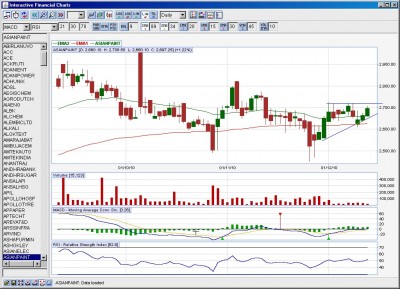
a few calls for btst/short term traders, they may be feeling neglected as we are concentrating more on intra-day trading. in fact, the market was not good for long positions for last couple of weeks and now also, i dont believe that we are easily going to make a new high. we have miles to go. but these calls which i am posting, may give u results with in 2-3 days max, i hope we will get that much time from market before it reverse the present trend
1.hcltech sym tri, target 450
2.cairn if breakes above 330 then we can get 340,350
3.berger paints if stays above 96 then we can get 100,105
4. asian paints a bo above 2700 can reach us to 2750.2800.2850
all charts are in daily time frames
| Description: |
|
| Filesize: |
188.12 KB |
| Viewed: |
263 Time(s) |
|
| Description: |
|
| Filesize: |
185.6 KB |
| Viewed: |
260 Time(s) |
|
| Description: |
|
| Filesize: |
183.73 KB |
| Viewed: |
254 Time(s) |
|
| Description: |
|
| Filesize: |
185.68 KB |
| Viewed: |
248 Time(s) |
|
|
|
| Back to top |
|
 |
mrvishal_g
White Belt

Joined: 17 Sep 2010
Posts: 89
|
Post: #702  Posted: Mon Dec 13, 2010 8:50 pm Post subject: Posted: Mon Dec 13, 2010 8:50 pm Post subject: |
 |
|
| casper wrote: | a few calls for btst/short term traders, they may be feeling neglected as we are concentrating more on intra-day trading. in fact, the market was not good for long positions for last couple of weeks and now also, i dont believe that we are easily going to make a new high. we have miles to go. but these calls which i am posting, may give u results with in 2-3 days max, i hope we will get that much time from market before it reverse the present trend
1.hcltech sym tri, target 450
2.cairn if breakes above 330 then we can get 340,350
3.berger paints if stays above 96 then we can get 100,105
4. asian paints a bo above 2700 can reach us to 2750.2800.2850
all charts are in daily time frames |
Thanks
this are my taste.........Vishal
|
|
| Back to top |
|
 |
casper
Green Belt

Joined: 02 Oct 2010
Posts: 1315
|
Post: #703  Posted: Tue Dec 14, 2010 8:13 am Post subject: Posted: Tue Dec 14, 2010 8:13 am Post subject: |
 |
|
welcome vishal
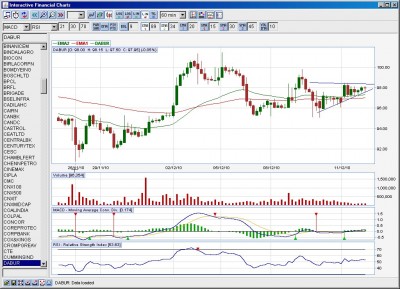
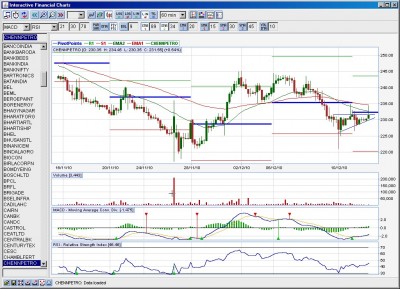
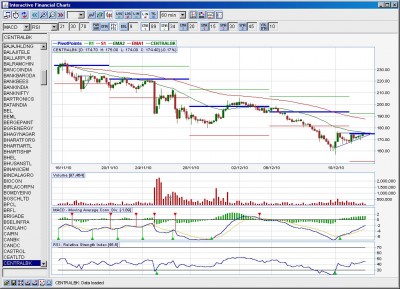
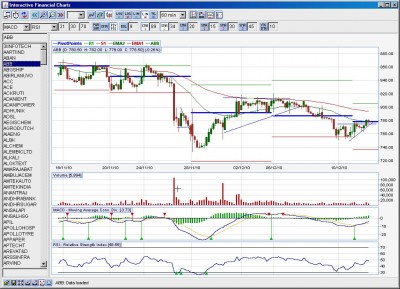
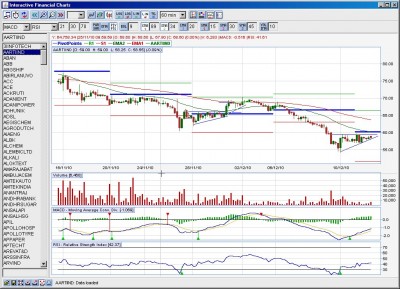
a few intraday set ups are here. all needs a bo to enter and after that, a candle close below the bo level will serve as sl. all set ups are of 60 min tf
1.aartiinds=strong resi at bo level, if a bo happen, target is 63.65
2.abb= same as aarti. bo level has strong resi as pivot and ema is present. enter wid a bo. target 795.800
3.centralbk=same case. pivot and ema is the hurdle, target 185.190
4.dabur = enter above 98. target 100.101
5.chennpetro = buy around 235. target 240.245
| Description: |
|
| Filesize: |
186.57 KB |
| Viewed: |
251 Time(s) |
|
| Description: |
|
| Filesize: |
202.91 KB |
| Viewed: |
261 Time(s) |
|
| Description: |
|
| Filesize: |
206.33 KB |
| Viewed: |
256 Time(s) |
|
| Description: |
|
| Filesize: |
202.85 KB |
| Viewed: |
247 Time(s) |
|
| Description: |
|
| Filesize: |
210.34 KB |
| Viewed: |
248 Time(s) |
|
|
|
| Back to top |
|
 |
thegani
White Belt

Joined: 03 Nov 2010
Posts: 21
|
Post: #704  Posted: Tue Dec 14, 2010 9:55 am Post subject: Posted: Tue Dec 14, 2010 9:55 am Post subject: |
 |
|
| casper wrote: | | thegani wrote: | hi casper ji kaha tha na 375 ke uper cipla ko close honedo.
jane do please tell me ke icharts me stock compare kaise kare
thanx |
hiii,
haan cipla to gir gaya, sath hi market bhi chala 
stocks compare karne ke liye jchart mein jaiye, symbol entry form ke niche dekhie ek dusra symbol dalne ka form hai.
upper wale form mein ek symbol daliye and niche mein dusre ko daliye fir enter kijiye
dikheye chart mein maine mark kar dia hai |
thanx bro
|
|
| Back to top |
|
 |
deepakms
White Belt

Joined: 13 Aug 2009
Posts: 194
|
Post: #705  Posted: Tue Dec 14, 2010 9:58 am Post subject: Posted: Tue Dec 14, 2010 9:58 am Post subject: |
 |
|
Hi Casper,
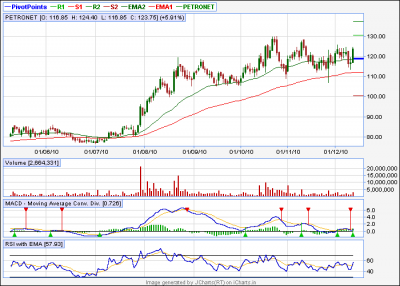
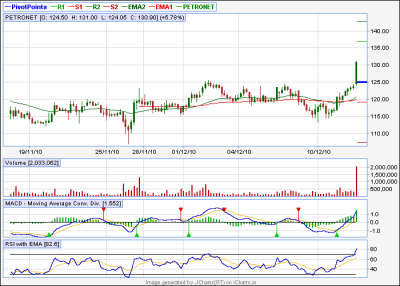
Take a look at the charts of petronet on daily and 60 min tf.
Ur comments please and possible tgts...............
Thnx/rgds
Deeppak
| Description: |
|
| Filesize: |
14.83 KB |
| Viewed: |
245 Time(s) |
|
| Description: |
|
| Filesize: |
13.55 KB |
| Viewed: |
248 Time(s) |
|
|
|
| Back to top |
|
 |
|

