| View previous topic :: View next topic |
| Author |
a layman's approach to break out and break down |
casper
Green Belt

Joined: 02 Oct 2010
Posts: 1315
|
Post: #706  Posted: Tue Dec 14, 2010 10:19 am Post subject: Posted: Tue Dec 14, 2010 10:19 am Post subject: |
 |
|
| deepakms wrote: | Hi Casper,
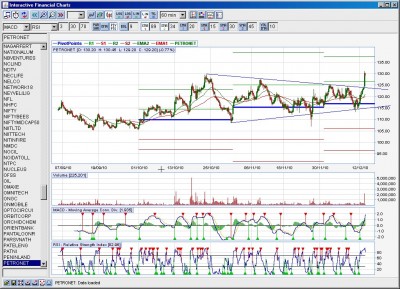
Take a look at the charts of petronet on daily and 60 min tf.
Ur comments please and possible tgts...............
Thnx/rgds
Deeppak |
it looks like an sym tri break out, i had to ask vishy for confirmation as i could not find the pattern by myself
target should be around 140-145, but we have 137 as monthly r2. so may face resistance here. try to enter with pull backs preferably with a 3 day rsi. wait for the 3 day rsi to turn over sold and when it heads upward, u can enter
its almost at all time high so we need to be cautious
| Description: |
|
| Filesize: |
235.76 KB |
| Viewed: |
248 Time(s) |
|
|
|
| Back to top |
|
 |
|
|
 |
vrushabh123
White Belt

Joined: 18 Nov 2010
Posts: 39
|
Post: #707  Posted: Tue Dec 14, 2010 10:34 am Post subject: hhii Posted: Tue Dec 14, 2010 10:34 am Post subject: hhii |
 |
|
hi casper,
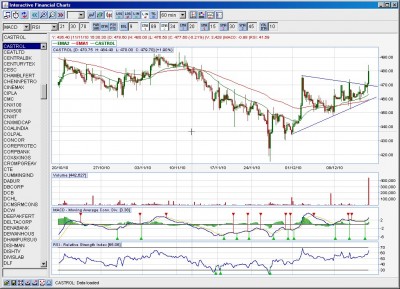
How r u... just need confirmation for castrol in dly chart is it asc tri..for which today BO has occured with huge vol..tgt comes around 515 roughly..
|
|
| Back to top |
|
 |
casper
Green Belt

Joined: 02 Oct 2010
Posts: 1315
|
Post: #708  Posted: Tue Dec 14, 2010 10:53 am Post subject: Re: hhii Posted: Tue Dec 14, 2010 10:53 am Post subject: Re: hhii |
 |
|
| vrushabh123 wrote: | hi casper,
How r u... just need confirmation for castrol in dly chart is it asc tri..for which today BO has occured with huge vol..tgt comes around 515 roughly.. |
hii, im fine thanks.
castrol looks like more of a sym tri as the upper tl is not flat
480 as monthly r1 and 478 as weekly r2 can be our targets
| Description: |
|
| Filesize: |
212.82 KB |
| Viewed: |
252 Time(s) |
|
|
|
| Back to top |
|
 |
vrushabh123
White Belt

Joined: 18 Nov 2010
Posts: 39
|
Post: #709  Posted: Tue Dec 14, 2010 10:58 am Post subject: hii Posted: Tue Dec 14, 2010 10:58 am Post subject: hii |
 |
|
| casper, just found invert H&S in mundra BO at 151 in dly chart resis at 154 tgt 180.. And sorry castrol EOD i was talking abt..pl check..it has also closed abv 89 ema of 466..
|
|
| Back to top |
|
 |
casper
Green Belt

Joined: 02 Oct 2010
Posts: 1315
|
Post: #710  Posted: Tue Dec 14, 2010 12:11 pm Post subject: Re: hii Posted: Tue Dec 14, 2010 12:11 pm Post subject: Re: hii |
 |
|
| vrushabh123 wrote: | | casper, just found invert H&S in mundra BO at 151 in dly chart resis at 154 tgt 180.. And sorry castrol EOD i was talking abt..pl check..it has also closed abv 89 ema of 466.. |
mundra is slopped inversed h/s. we can consider it as channels also. bo above 151
and castrol is at in daily but look at 480 as monthly r1,we can get some resistance here
|
|
| Back to top |
|
 |
vrushabh123
White Belt

Joined: 18 Nov 2010
Posts: 39
|
Post: #711  Posted: Tue Dec 14, 2010 12:14 pm Post subject: Thanks Posted: Tue Dec 14, 2010 12:14 pm Post subject: Thanks |
 |
|
okk thanks...a lot.. 
|
|
| Back to top |
|
 |
kanna
White Belt

Joined: 03 Jan 2010
Posts: 91
|
Post: #712  Posted: Tue Dec 14, 2010 12:15 pm Post subject: Posted: Tue Dec 14, 2010 12:15 pm Post subject: |
 |
|
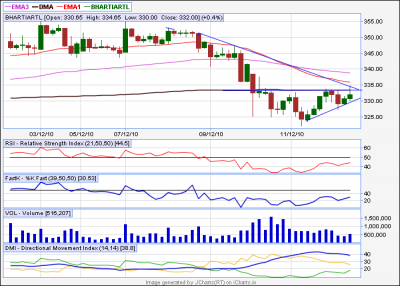
bharti on the verge of a BO or BD
both 60 min and 15 min charts attached in two posts
| Description: |
|
| Filesize: |
30.01 KB |
| Viewed: |
272 Time(s) |
|
|
|
| Back to top |
|
 |
kanna
White Belt

Joined: 03 Jan 2010
Posts: 91
|
Post: #713  Posted: Tue Dec 14, 2010 12:16 pm Post subject: Posted: Tue Dec 14, 2010 12:16 pm Post subject: |
 |
|
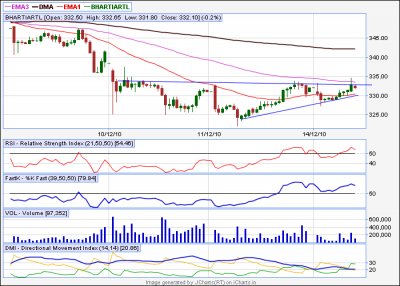
15min charts for bharti
| Description: |
|
| Filesize: |
28.22 KB |
| Viewed: |
250 Time(s) |
|
|
|
| Back to top |
|
 |
casper
Green Belt

Joined: 02 Oct 2010
Posts: 1315
|
Post: #714  Posted: Tue Dec 14, 2010 12:22 pm Post subject: Posted: Tue Dec 14, 2010 12:22 pm Post subject: |
 |
|
| kanna wrote: | bharti on the verge of a BO or BD
both 60 min and 15 min charts attached in two posts |
it can give u a bo as it is more of an ascending triangle and macd is in buy mode, but 336-340 is the toughest zone, it got 89 and 34 ema , monthly pivot and weekly pivot also. so watch out
i checked it only in 60 min and ema position is also as per 60 min
|
|
| Back to top |
|
 |
chandrujimrc
Brown Belt

Joined: 21 Apr 2009
Posts: 1683
|
Post: #715  Posted: Tue Dec 14, 2010 9:33 pm Post subject: a laymans" approach to breakout and breakdown Posted: Tue Dec 14, 2010 9:33 pm Post subject: a laymans" approach to breakout and breakdown |
 |
|
Dear Casperji,
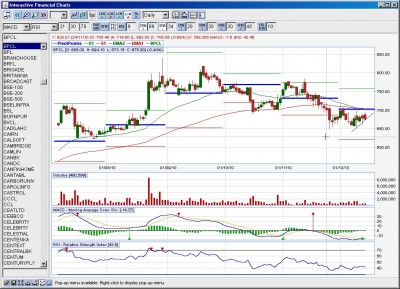
If possible can u post your view about Bpcl on Eod basis{which is in NVK set up also}Sorry unable to post charts.
chandru.
|
|
| Back to top |
|
 |
chandrujimrc
Brown Belt

Joined: 21 Apr 2009
Posts: 1683
|
Post: #716  Posted: Tue Dec 14, 2010 9:39 pm Post subject: a laymans" approach to breakout and breakdown Posted: Tue Dec 14, 2010 9:39 pm Post subject: a laymans" approach to breakout and breakdown |
 |
|
Dear Casperji,
If possible can u post your view about Bpcl on Eod basis{which is in NVK set up also}Sorry unable to post charts.
chandru.
|
|
| Back to top |
|
 |
casper
Green Belt

Joined: 02 Oct 2010
Posts: 1315
|
Post: #717  Posted: Wed Dec 15, 2010 8:57 am Post subject: Re: a laymans" approach to breakout and breakdown Posted: Wed Dec 15, 2010 8:57 am Post subject: Re: a laymans" approach to breakout and breakdown |
 |
|
| chandrujimrc wrote: | Dear Casperji,
If possible can u post your view about Bpcl on Eod basis{which is in NVK set up also}Sorry unable to post charts.
chandru. |
hi chndruji, look at the chart i posted. it looks like an ascending triangle for a short term, but both the most important emas,like 34 and 89 ema and monthly pivot is hovering to choke any upmove, moreover both ema has given a negative cross over, viz 34 has crossed 89 or u can see now crossing 89 in a downward motion.
but on the other hand, this stock is moving on the news of petro price hike.
we can approach this stock in a few ways
1. firstly. we can wait for a break out and if price sustains above resistance level then with the support of that level, we can buy, but volume will play an important role here
2.secondly we can let the stock go down at 620 level and let the rsi be oversold, then with a green candle we can accumulate it for a target of 680-700.here we need the rsi to get oversold first then we can buy when a green candle appear and rsi starts rising
3 or thirdly if the stock hits 700 and goes down, we can short it with a target of 620 and stop loss of a eod candle close above the resistance level of 700, but given the price hike news,this could be a risky option
| Description: |
|
| Filesize: |
208.24 KB |
| Viewed: |
242 Time(s) |
|
|
|
| Back to top |
|
 |
deepakms
White Belt

Joined: 13 Aug 2009
Posts: 194
|
Post: #718  Posted: Wed Dec 15, 2010 9:10 am Post subject: Posted: Wed Dec 15, 2010 9:10 am Post subject: |
 |
|
Hi Casper,
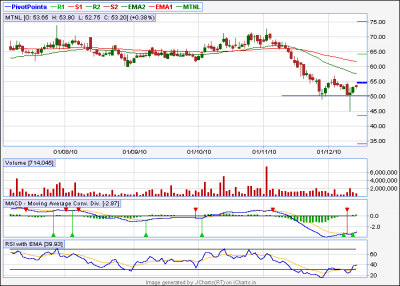
MTNL seem to have a NVK set-up.
But the 34 ema cross-over is yet to happen,but has closed above the pivot on the 60min tf.
Suggestion pls....stort term tradable ????
thnx/Rgds
Deeppak
| Description: |
|
| Filesize: |
12.48 KB |
| Viewed: |
229 Time(s) |
|
|
|
| Back to top |
|
 |
casper
Green Belt

Joined: 02 Oct 2010
Posts: 1315
|
Post: #719  Posted: Wed Dec 15, 2010 9:16 am Post subject: Posted: Wed Dec 15, 2010 9:16 am Post subject: |
 |
|
deepak, im sooorrrryyy brother, i dont understand nvk set up clearly, because im soo poor in divergence trading. plz ask it sumesh or saikat sir.
u can catch saikat sir in sb. or if sumesh has returned from his vacation he also may comment on it
sumesh. brother, if u r here, plz take a look and comment
|
|
| Back to top |
|
 |
sumesh_sol
Brown Belt

Joined: 06 Jun 2010
Posts: 2344
|
Post: #720  Posted: Wed Dec 15, 2010 9:40 am Post subject: Posted: Wed Dec 15, 2010 9:40 am Post subject: |
 |
|
| casper wrote: | deepak, im sooorrrryyy brother, i dont understand nvk set up clearly, because im soo poor in divergence trading. plz ask it sumesh or saikat sir.
u can catch saikat sir in sb. or if sumesh has returned from his vacation he also may comment on it
sumesh. brother, if u r here, plz take a look and comment |
Hi Deepak & all my friends,
A warm hello to all of you.. I'm back , but may not be able to actively trade till next week due to official engagements. However, will definetely try to answer queries with whatever little info I have ..
Deepak , this is one of those perfect nvk I have always wished for. The secong leg has such a long tail which shows the inherent strength of the setup. I feel the targets for this nvk trade are 58 & 63.5.
Regards,
Sumesh
|
|
| Back to top |
|
 |
|

