|
|
| View previous topic :: View next topic |
| Author |
a layman's approach to break out and break down |
newinvestor
White Belt

Joined: 16 Feb 2010
Posts: 120
|
Post: #76  Posted: Sun Oct 31, 2010 11:35 am Post subject: Posted: Sun Oct 31, 2010 11:35 am Post subject: |
 |
|
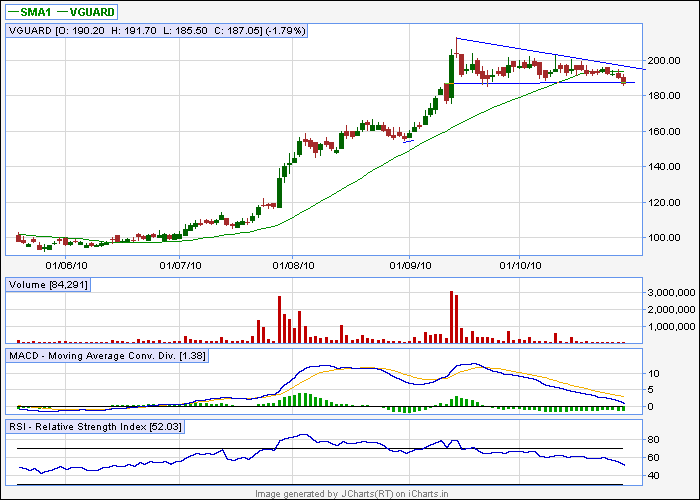
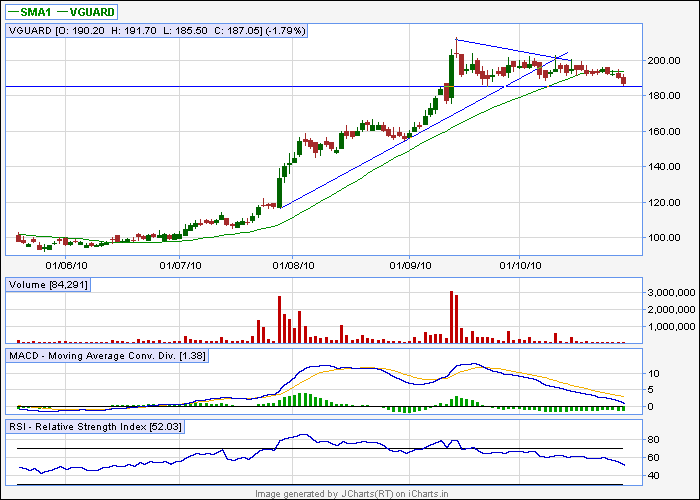
Can you pls check chart of Vguard. This seems to be a classic symmetrical pattern. In the past 6 weeks , two lower tops and two higher bottoms, volumes almost non existent and now on Friday breaking down from the line.
But still no volume increase .
|
|
| Back to top |
|
 |
|
|  |
casper
Green Belt

Joined: 02 Oct 2010
Posts: 1315
|
Post: #77  Posted: Sun Oct 31, 2010 12:07 pm Post subject: Posted: Sun Oct 31, 2010 12:07 pm Post subject: |
 |
|
hi girishhu1,
congratulation, ur posts shows that u r working really hard. plz keep it up.
while there is some prbs and some charts are not updated up to last Fri day, but it shows that u r trying and that's a great thing 
im going to write what i understood from ur posts here.
1.aloketext: nice pattern with vol confirmations. we may enter at 29-30 range, but as of now, we don't know if its going to be a rounding bottom or cup and handle. so it will be good if we prepare mentally for a lil bit consolidation at the bo level(cup &handle)
plz do remember that, in that case, the price may go down up to 1/3 of the right arms expansion
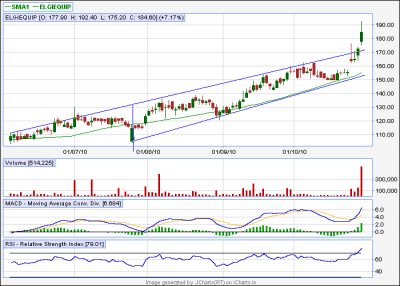
2.elgiequip: a channel bo has occurred , target will be 200-205, see the widest part in the chart i posted and one more thing, bo is at 170, no in 165
3.glenmark: its alright. but dont exit at 365, it may go up to 375 under favorable condition
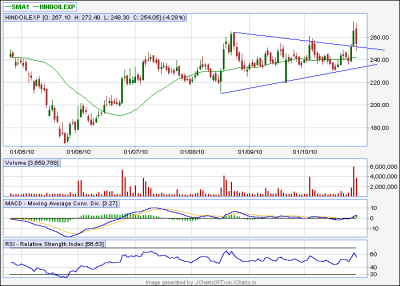
4.hindoilexp: broken out of a symmetrical triangle, but could not sustain, it has to take support at the bo level before it resumes the upmove, plz see the chart
5.jswsteel: i already posted the chart in response of mrvishal_g, its a cup and handle forming , plz see that chart
6.rajesexpo: not a very robust or classical formation, and it could not sustain above the bo. wait for a close above 123 with good vol
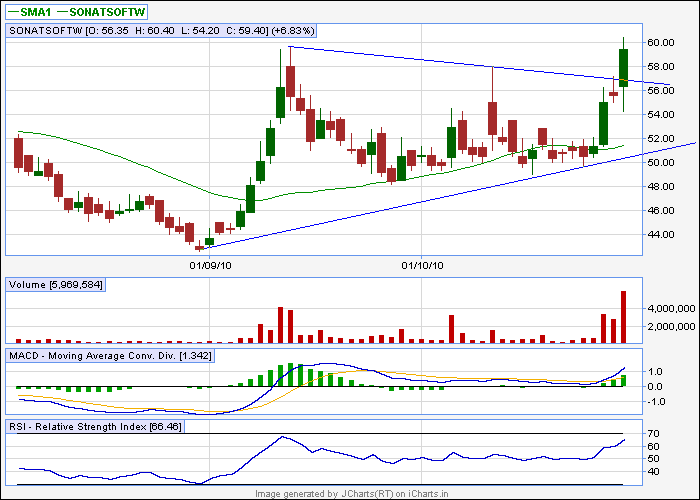
7.sonatsofw: while target is ok, but drawing should be a lil bit changed, plz see the chart
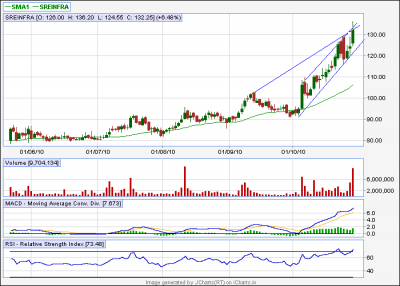
8 sreiinfra:i did not understand why target 172 here? for me, after clearing 135 by closing, it would give 140.145-150
can u plz explain why target 172?
| Description: |
|
| Filesize: |
10.2 KB |
| Viewed: |
2191 Time(s) |
|
| Description: |
|
| Filesize: |
12 KB |
| Viewed: |
453 Time(s) |
|
| Description: |
|
| Filesize: |
12.92 KB |
| Viewed: |
479 Time(s) |
|
| Description: |
|
| Filesize: |
12.11 KB |
| Viewed: |
457 Time(s) |
|
|
|
| Back to top |
|
 |
casper
Green Belt

Joined: 02 Oct 2010
Posts: 1315
|
Post: #78  Posted: Sun Oct 31, 2010 12:19 pm Post subject: Posted: Sun Oct 31, 2010 12:19 pm Post subject: |
 |
|
hi newinvestor,
in 2nd chart i attached, its more of a pennant than a sym triangle.
(plz remember here that pennants are smaller sym triangle)
but in 1st chart, with some imagination, we have turned it to be a yet to be broken down descending triangle, so as per our 1st chart its a descending triangle is forming.---- that's why there is no significant volume. i believe, that vol will be back once a break down takes place from the current level
| Description: |
|
| Filesize: |
11.15 KB |
| Viewed: |
2180 Time(s) |
|
| Description: |
|
| Filesize: |
11.53 KB |
| Viewed: |
2180 Time(s) |
|
|
|
| Back to top |
|
 |
girishhu1
White Belt

Joined: 17 Aug 2009
Posts: 316
|
Post: #79  Posted: Sun Oct 31, 2010 1:16 pm Post subject: Posted: Sun Oct 31, 2010 1:16 pm Post subject: |
 |
|
hellow casperji,
thanks a lot for your comments.
i have taken difference beween hi and lo point of ascending triangle and posted it above bo point which works out to be 172 approx.
regards
girish
|
|
| Back to top |
|
 |
newinvestor
White Belt

Joined: 16 Feb 2010
Posts: 120
|
Post: #80  Posted: Sun Oct 31, 2010 3:07 pm Post subject: Posted: Sun Oct 31, 2010 3:07 pm Post subject: |
 |
|
| casper wrote: | hi girishhu1,
congratulation, ur posts shows that u r working really hard. plz keep it up.
while there is some prbs and some charts are not updated up to last Fri day, but it shows that u r trying and that's a great thing 
im going to write what i understood from ur posts here.
1.aloketext: nice pattern with vol confirmations. we may enter at 29-30 range, but as of now, we don't know if its going to be a rounding bottom or cup and handle. so it will be good if we prepare mentally for a lil bit consolidation at the bo level(cup &handle)
plz do remember that, in that case, the price may go down up to 1/3 of the right arms expansion
Yes Grishu1, good job.
Casper, I am going to read your earlier post reg pennant and come back
Tks
2.elgiequip: a channel bo has occurred , target will be 200-205, see the widest part in the chart i posted and one more thing, bo is at 170, no in 165
3.glenmark: its alright. but dont exit at 365, it may go up to 375 under favorable condition
4.hindoilexp: broken out of a symmetrical triangle, but could not sustain, it has to take support at the bo level before it resumes the upmove, plz see the chart
5.jswsteel: i already posted the chart in response of mrvishal_g, its a cup and handle forming , plz see that chart
6.rajesexpo: not a very robust or classical formation, and it could not sustain above the bo. wait for a close above 123 with good vol
7.sonatsofw: while target is ok, but drawing should be a lil bit changed, plz see the chart
8 sreiinfra:i did not understand why target 172 here? for me, after clearing 135 by closing, it would give 140.145-150
can u plz explain why target 172? |
|
|
| Back to top |
|
 |
casper
Green Belt

Joined: 02 Oct 2010
Posts: 1315
|
Post: #81  Posted: Sun Oct 31, 2010 3:44 pm Post subject: Posted: Sun Oct 31, 2010 3:44 pm Post subject: |
 |
|
| girishhu1 wrote: | hellow casperji,
thanks a lot for your comments.
i have taken difference beween hi and lo point of ascending triangle and posted it above bo point which works out to be 172 approx.
regards
girish |
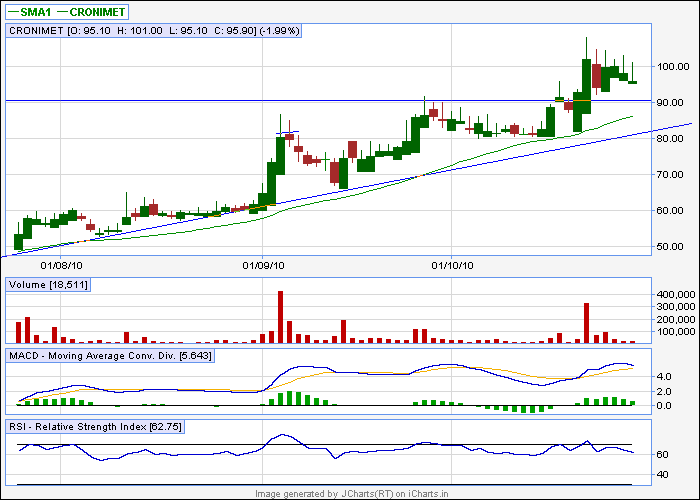
but brother girishhu1, sreiinfra is not an ascending triangle.
in case of ascending triangle THE UPPER TREND LINE SHOULD BE FLAT, NOT INCLINED, AND THE LOWER TREND LINE SHOULD BE INCLINED.
as it is one of the most profitable patterns, so im posting an example of ascending triangle once more,
| Description: |
|
| Filesize: |
9.74 KB |
| Viewed: |
2258 Time(s) |
|
|
|
| Back to top |
|
 |
girishhu1
White Belt

Joined: 17 Aug 2009
Posts: 316
|
Post: #82  Posted: Sun Oct 31, 2010 3:53 pm Post subject: Posted: Sun Oct 31, 2010 3:53 pm Post subject: |
 |
|
| followed and thanks again
|
|
| Back to top |
|
 |
mrvishal_g
White Belt

Joined: 17 Sep 2010
Posts: 89
|
Post: #83  Posted: Sun Oct 31, 2010 4:05 pm Post subject: Posted: Sun Oct 31, 2010 4:05 pm Post subject: |
 |
|
Thanks Casper
what is your picks for monday.

|
|
| Back to top |
|
 |
casper
Green Belt

Joined: 02 Oct 2010
Posts: 1315
|
Post: #84  Posted: Sun Oct 31, 2010 5:55 pm Post subject: Posted: Sun Oct 31, 2010 5:55 pm Post subject: |
 |
|
| mrvishal_g wrote: | Thanks Casper
what is your picks for monday.
 |
today u ppl have not left me with enough room for recommendations. u already have bagged all the good ones. 
(i just cant describe how much happy i am, ur enthusiasm is my encouragement)
but still apart from ur picks, i will also concentrate on the followings
1. cumminsind: earlier i mentioned that its target is around 850, its now 794, so can be entered again.(not posting its chart, already posted)
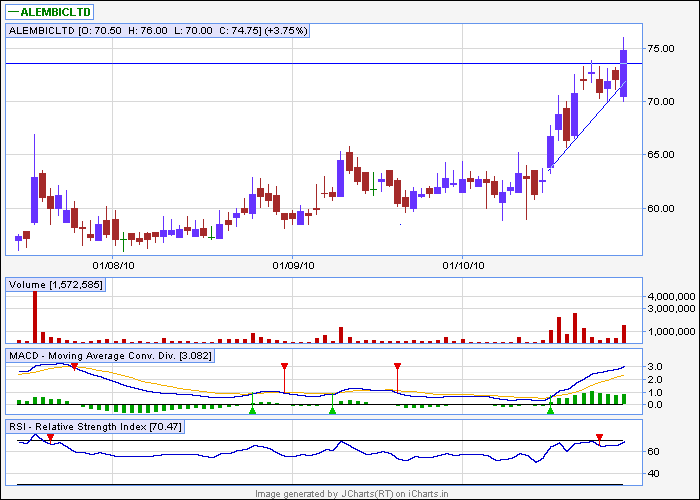
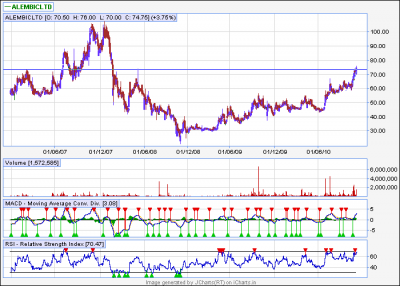
2.alembicltd: it can be traded for a btst with a target 80-83-85, as an ascending triangle
again it can be traded as a rounding bottom for a mid term with a target of 100-110, as it has crossed the highest reaction high level
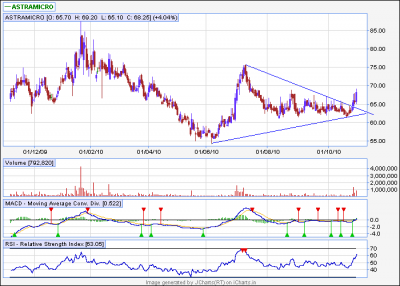
3.astramicro: this is last one, i wish it could be a lil more composed, specially the lower tl is not that composed, it has only 2 points to intersect the lower tl, if it sustain this level then i hope to see 75-80 in coming days
this can also be treated as a forming of rounding bottom,where a mid term target would be around 75
| Description: |
|
| Filesize: |
9.78 KB |
| Viewed: |
2272 Time(s) |
|
| Description: |
|
| Filesize: |
17.32 KB |
| Viewed: |
458 Time(s) |
|
| Description: |
|
| Filesize: |
14.55 KB |
| Viewed: |
483 Time(s) |
|
|
|
| Back to top |
|
 |
girishhu1
White Belt

Joined: 17 Aug 2009
Posts: 316
|
Post: #85  Posted: Sun Oct 31, 2010 8:59 pm Post subject: Posted: Sun Oct 31, 2010 8:59 pm Post subject: |
 |
|
casperji,
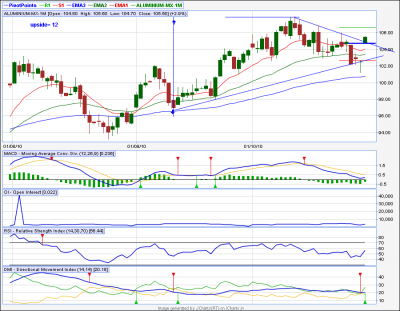
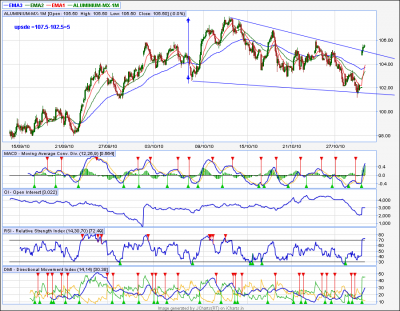
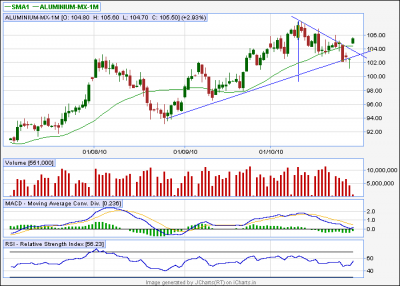
i dont know much about commodities but i am enclosing a chart of aluminium.will you pl comment on this one also? 
| Description: |
|
| Filesize: |
53.71 KB |
| Viewed: |
434 Time(s) |
|
| Description: |
|
| Filesize: |
75.87 KB |
| Viewed: |
439 Time(s) |
|
|
|
| Back to top |
|
 |
newinvestor
White Belt

Joined: 16 Feb 2010
Posts: 120
|
Post: #86  Posted: Mon Nov 01, 2010 8:26 am Post subject: Posted: Mon Nov 01, 2010 8:26 am Post subject: |
 |
|
| Do we stop tracking Provogue, as the b/o did not continue on friday, and also vol came down?
|
|
| Back to top |
|
 |
casper
Green Belt

Joined: 02 Oct 2010
Posts: 1315
|
Post: #87  Posted: Mon Nov 01, 2010 8:28 am Post subject: Posted: Mon Nov 01, 2010 8:28 am Post subject: |
 |
|
i never traded or worked with with commodities, but from theoretical point of view, i can say that the 1 st chart looks like a pennant, a bo has occur. target will be 7 rupees, instead of 12 rupees, see the chart. but the prb is no significant vol is seen.
and the 2nd chart is not available in my jchart eod comm, may be its a real time chart, in this chart a symmetrical triangle/ pennant like formation is seen. though it is not very robust
| Description: |
|
| Filesize: |
12.23 KB |
| Viewed: |
397 Time(s) |
|
|
|
| Back to top |
|
 |
casper
Green Belt

Joined: 02 Oct 2010
Posts: 1315
|
Post: #88  Posted: Mon Nov 01, 2010 8:37 am Post subject: Posted: Mon Nov 01, 2010 8:37 am Post subject: |
 |
|
| newinvestor wrote: | | Do we stop tracking Provogue, as the b/o did not continue on friday, and also vol came down? |
no, a doji has formed, it implies an indecision between the trader, and the price is above our upper tl, so today's close is important to come to a decision, as long as it stays above the bo zone (viz. upper tl)
we can track it,
and though the vol of Friday could not match to the vol of Thursday, still the vol is high against the avg vol during the consolidation.
so as a whole, we will have to see today at least
|
|
| Back to top |
|
 |
casper
Green Belt

Joined: 02 Oct 2010
Posts: 1315
|
Post: #89  Posted: Mon Nov 01, 2010 9:59 am Post subject: Posted: Mon Nov 01, 2010 9:59 am Post subject: |
 |
|
i really could not make out whats going on.
just shorted cummins fut at 812. booked at 805 (fearfully)
we are moving between a band of 18-20 rupees.(nifty)
a break thru is needed
|
|
| Back to top |
|
 |
girishhu1
White Belt

Joined: 17 Aug 2009
Posts: 316
|
Post: #90  Posted: Tue Nov 02, 2010 6:44 am Post subject: Posted: Tue Nov 02, 2010 6:44 am Post subject: |
 |
|
hellow casperji,
i m enclosing an excell sheet indicating status of stocks discussed by us. please comment.
| Description: |
|

Download |
| Filename: |
bo.xls |
| Filesize: |
13.5 KB |
| Downloaded: |
561 Time(s) |
| Description: |
|

Download |
| Filename: |
bo.xls |
| Filesize: |
13.5 KB |
| Downloaded: |
459 Time(s) |
|
|
| Back to top |
|
 |
|
|
You cannot post new topics in this forum
You cannot reply to topics in this forum
You cannot edit your posts in this forum
You cannot delete your posts in this forum
You cannot vote in polls in this forum
You can attach files in this forum
You can download files in this forum
|
Powered by phpBB © 2001, 2005 phpBB Group
|
|
|

