|
|
| View previous topic :: View next topic |
| Author |
a layman's approach to break out and break down |
singh.ravee
Yellow Belt

Joined: 12 Aug 2010
Posts: 678
|
Post: #766  Posted: Fri Dec 17, 2010 1:36 pm Post subject: Posted: Fri Dec 17, 2010 1:36 pm Post subject: |
 |
|
Sumesh ji,
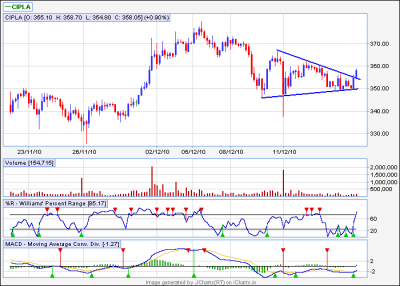
jara cipla 60tf ke chart ko is tarah se dekho.
1. similar triangle
2. volume falling during the formation of triangle. so chart conditions met
3. macd buy signal. second last candle still below falling trend line.
4. next candle breakout above falling line.
5. as per casper, if macd buy signal is obtained before actual breakout, then possibility of true breakout is higher.
6. so lets expect a good run from here.
rgds
ravee
| Description: |
|
| Filesize: |
13.38 KB |
| Viewed: |
235 Time(s) |
|
|
|
| Back to top |
|
 |
|
|  |
casper
Green Belt

Joined: 02 Oct 2010
Posts: 1315
|
Post: #767  Posted: Fri Dec 17, 2010 1:49 pm Post subject: Posted: Fri Dec 17, 2010 1:49 pm Post subject: |
 |
|
[quote="sumesh_sol"] | deepakms wrote: | Sumesh/Casper ,
Andhra bank trading flat and ascending upwards,but can it break out ?
Ur comments pls...........
Thnx/Rgds
Deeppak[/quot
Hi Deepak,
Like you said, it is trading flat... means there in not much encouraging MACD and RSI builtup while pattern formation.. If market trades higher, it might also breaks out, but the strenght to sustain and move rapidly is less because of weak MACD and RSI so far...
It will get strong resistance at around 153-154, because of TL and presence of 89 SMA(hourly)
This is my observation, I may be wrong also..... |
i am adding only one point here 
let us enter here only after a break upon the 89 ema with increased volume, in that case the bo will sustain and macd /rsi will get more strength due to added volume
for an example,see the present average vol per candle during pattern formation is below 1 lakh. if the bo candle makes a vol at least 1.5-2 lakh, then we can say that demand is surging for the stock and we can expect around 160 levels soon
|
|
| Back to top |
|
 |
casper
Green Belt

Joined: 02 Oct 2010
Posts: 1315
|
Post: #768  Posted: Fri Dec 17, 2010 2:08 pm Post subject: Posted: Fri Dec 17, 2010 2:08 pm Post subject: |
 |
|
| singh.ravee wrote: | Sumesh ji,
jara cipla 60tf ke chart ko is tarah se dekho.
1. similar triangle
2. volume falling during the formation of triangle. so chart conditions met
3. macd buy signal. second last candle still below falling trend line.
4. next candle breakout above falling line.
5. as per casper, if macd buy signal is obtained before actual breakout, then possibility of true breakout is higher.
6. so lets expect a good run from here.
rgds
ravee |
wow ravi. nicely explained just one thing i am asking. did u mean symmetrical triangle by similar triangle?
the way u ppls are participating, i am sure that soon u will be able to compete any professional trader!!!
i am so happy to see you progress by leaps and bounds, plz keep it up
by the way, plz write me about ur experience with st sir's thread. was not it of great help?
|
|
| Back to top |
|
 |
singh.ravee
Yellow Belt

Joined: 12 Aug 2010
Posts: 678
|
Post: #769  Posted: Fri Dec 17, 2010 2:13 pm Post subject: Posted: Fri Dec 17, 2010 2:13 pm Post subject: |
 |
|
| casper wrote: |
wow ravi. nicely explained just one thing i am asking. did u mean symmetrical triangle by similar triangle?
the way u ppls are participating, i am sure that soon u will be able to compete any professional trader!!!
i am so happy to see you progress by leaps and bounds, plz keep it up
by the way, plz write me about ur experience with st sir's thread. was not it of great help? |
For me symmetrical triangle= similar triangle.
ST sir's thread is a good experience. It has improved my intraday entry points in a stock signficantly.
Lets hope that ST sir soon restart a thread for the benefit of all.
rgds
|
|
| Back to top |
|
 |
sumesh_sol
Brown Belt

Joined: 06 Jun 2010
Posts: 2344
|
Post: #770  Posted: Fri Dec 17, 2010 10:16 pm Post subject: EIHOTEL.. 60 tf.. Posted: Fri Dec 17, 2010 10:16 pm Post subject: EIHOTEL.. 60 tf.. |
 |
|
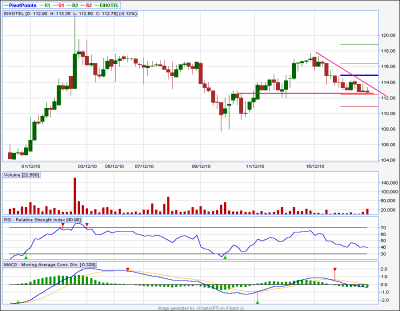
EIHOTEL.. 60 tf..
===================
Can breakdown to the level of 107 ..
-Sumesh
| Description: |
|
| Filesize: |
36.43 KB |
| Viewed: |
225 Time(s) |
|
|
|
| Back to top |
|
 |
girishhu1
White Belt

Joined: 17 Aug 2009
Posts: 316
|
Post: #771  Posted: Sat Dec 18, 2010 7:40 am Post subject: auro pharma Posted: Sat Dec 18, 2010 7:40 am Post subject: auro pharma |
 |
|
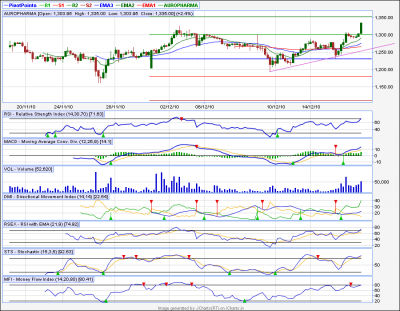
will this bo sustain on monday?
regards,
girish
| Description: |
|
| Filesize: |
52.67 KB |
| Viewed: |
208 Time(s) |
|
|
|
| Back to top |
|
 |
casper
Green Belt

Joined: 02 Oct 2010
Posts: 1315
|
Post: #772  Posted: Sat Dec 18, 2010 8:12 am Post subject: Re: auro pharma Posted: Sat Dec 18, 2010 8:12 am Post subject: Re: auro pharma |
 |
|
| girishhu1 wrote: | will this bo sustain on monday?
regards,
girish |
while pattern in real time is some what not so impressive but in eod it looks good
we need to watch out its reaction at 1350, it is weekly r2. monthly r1 and it is the recent top which was formed on november 8th
as per eod chart, above 1350, we can expect at least 1400 and then 1450
|
|
| Back to top |
|
 |
yawalkar
White Belt

Joined: 02 Oct 2010
Posts: 58
|
|
| Back to top |
|
 |
casper
Green Belt

Joined: 02 Oct 2010
Posts: 1315
|
Post: #774  Posted: Sat Dec 18, 2010 9:15 am Post subject: Re: HERO HONDA Posted: Sat Dec 18, 2010 9:15 am Post subject: Re: HERO HONDA |
 |
|
| yawalkar wrote: | | casper wrote: | | yawalkar wrote: | Dear Casper,
Can you check hero honda? On 5 m t/f there is just 2-3 Rs. movement from morning.
What going to happen? |
sorry brother. i was very busy. so could not see ur post. hero honda already did well. i hope u have got good profit from it
right now in 60 min tf. it has got 34 ema and weekly s1 just above the last candle. so we can get good moves only after breaking them |
Dear ALL,
Here I am posting my wonderful experience with I chart.
On Thursday 16.12.2010 I have decided to trade with herohonda as it was down on Wednesday.
I watched hero Honda move till 10.0 am. When it crossed 34 ema I bought a 1650 call at 64 rs.
Within half hour it touches 1650 at 89 ema. After it slips down till 1623. And after that I have seen only 2-5 Rs. move in that. Indicator details are shown in chart. MACD near zero line, RSI flat, very low volume. So I am very nervous. But I have added one more indicator DMI. I have read About DMI last night (Wednesday) I don’t remember from which thread I read it. But as per this indicator an uptrend is forming. My hopes were only on this indicator. You can see the candles in chart from 10.45am to 2.00 pm. I was very nervous because all other indicators are not in my favor. But DMI index was moved from 25 to 50 in this period. And at last at 2.05 pm herohonda started to move in upward & touched 1700. At that time my 1650 call was at Rs. 95.
So thanks to all I chart member who are sharing there knowledge with newbie. I give my thanks to I chart team who has given such a wonderful software.
I am not happy because I got a profit but I learn a most wonderful experience from I chart and software.
Thanks A lot…… to all my seniors , I chart owner and my new friends.
   |
  
first it was girish.hu1,newinvestor then vishy.tns followed by mr.vishal_g and sing.ravee, now its u brother yawalker. and i know one more who stays all the day wid me form 9 am to 10.30 pm everyday, wid some breaks 
looks like u are progressing such a way that soon we,who are trading a little longer, are going to get a tough time  
i have always prayed and will be always praying that may the HOLY MOTHER bless you with more and more success and may all of you enjoy a lot while you discover newer avenues in the wonderful world of technical analysis, AMEN
 ( this smile is called YMCA for me its YOUNG MEN CHARTIST ASSOCIATION) ( this smile is called YMCA for me its YOUNG MEN CHARTIST ASSOCIATION)
|
|
| Back to top |
|
 |
singh.ravee
Yellow Belt

Joined: 12 Aug 2010
Posts: 678
|
Post: #775  Posted: Sat Dec 18, 2010 10:01 am Post subject: Posted: Sat Dec 18, 2010 10:01 am Post subject: |
 |
|
Casper
Hello,
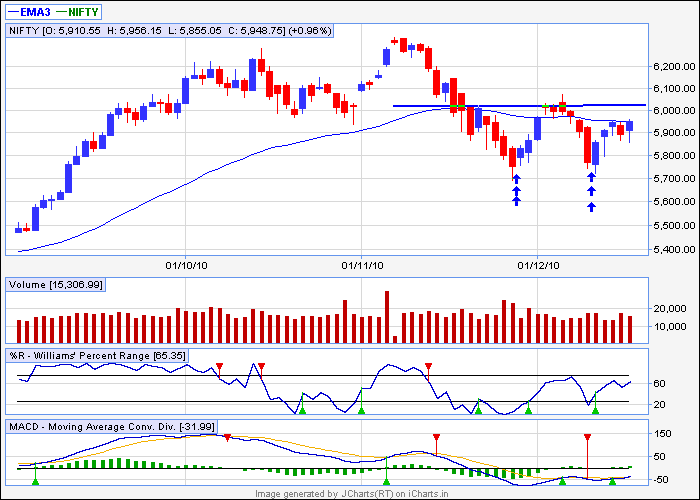
I am attaching eod chart of nifty spot.
1. I could see a double bottom formation in nifty spot around 5750 level marked by upward arrows.
2. Neckline of the pattern lies around 6015.
3. 50ema= 5950.
4. MACD is in buy mode.
4. If nifty moves up then it will be breaking 50 ema as well as neckline of pattern. In such scenario there will be double confirmation of the uptrend.
I think if pattern completes succesfully then one can think of going long on nifty above 6030 level for target of 6250 and sl= 6000. One has to adjust the nifty futures figures accordingly based upon the premium.
Kindly share your observation on attached chart.
Thanks and regards
ravee
| Description: |
|
| Filesize: |
11.61 KB |
| Viewed: |
894 Time(s) |
|
|
|
| Back to top |
|
 |
vishytns
White Belt

Joined: 26 Nov 2009
Posts: 206
|
Post: #776  Posted: Sat Dec 18, 2010 10:10 am Post subject: Re: HERO HONDA Posted: Sat Dec 18, 2010 10:10 am Post subject: Re: HERO HONDA |
 |
|
Great going guys, Sumesh and Casper provide their experiences everyday, I think you should also start posting your intraday calls and findings, Share your results of the trade. I think casper and sumesh can guide you long way.
Casper and Sumesh, great mentoring buddies.....Keep up the good work...

| casper wrote: | | yawalkar wrote: | | casper wrote: | | yawalkar wrote: | Dear Casper,
Can you check hero honda? On 5 m t/f there is just 2-3 Rs. movement from morning.
What going to happen? |
sorry brother. i was very busy. so could not see ur post. hero honda already did well. i hope u have got good profit from it
right now in 60 min tf. it has got 34 ema and weekly s1 just above the last candle. so we can get good moves only after breaking them |
Dear ALL,
Here I am posting my wonderful experience with I chart.
On Thursday 16.12.2010 I have decided to trade with herohonda as it was down on Wednesday.
I watched hero Honda move till 10.0 am. When it crossed 34 ema I bought a 1650 call at 64 rs.
Within half hour it touches 1650 at 89 ema. After it slips down till 1623. And after that I have seen only 2-5 Rs. move in that. Indicator details are shown in chart. MACD near zero line, RSI flat, very low volume. So I am very nervous. But I have added one more indicator DMI. I have read About DMI last night (Wednesday) I don’t remember from which thread I read it. But as per this indicator an uptrend is forming. My hopes were only on this indicator. You can see the candles in chart from 10.45am to 2.00 pm. I was very nervous because all other indicators are not in my favor. But DMI index was moved from 25 to 50 in this period. And at last at 2.05 pm herohonda started to move in upward & touched 1700. At that time my 1650 call was at Rs. 95.
So thanks to all I chart member who are sharing there knowledge with newbie. I give my thanks to I chart team who has given such a wonderful software.
I am not happy because I got a profit but I learn a most wonderful experience from I chart and software.
Thanks A lot…… to all my seniors , I chart owner and my new friends.
   |
  
first it was girish.hu1,newinvestor then vishy.tns followed by mr.vishal_g and sing.ravee, now its u brother yawalker. and i know one more who stays all the day wid me form 9 am to 10.30 pm everyday, wid some breaks 
looks like u are progressing such a way that soon we,who are trading a little longer, are going to get a tough time  
i have always prayed and will be always praying that may the HOLY MOTHER bless you with more and more success and may all of you enjoy a lot while you discover newer avenues in the wonderful world of technical analysis, AMEN
 ( this smile is called YMCA for me its YOUNG MEN CHARTIST ASSOCIATION) ( this smile is called YMCA for me its YOUNG MEN CHARTIST ASSOCIATION) |
|
|
| Back to top |
|
 |
vishytns
White Belt

Joined: 26 Nov 2009
Posts: 206
|
Post: #777  Posted: Sat Dec 18, 2010 10:42 am Post subject: Posted: Sat Dec 18, 2010 10:42 am Post subject: |
 |
|
Casper/Sumesh,
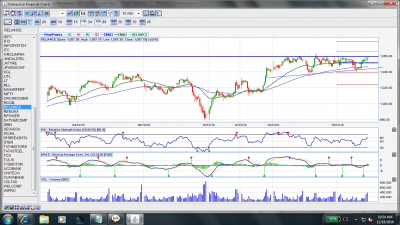
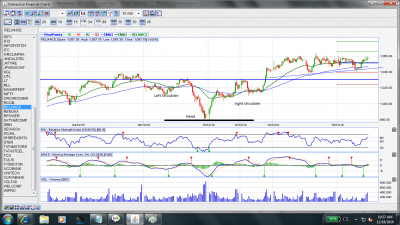
I am attaching the charts of Reliance AT and Reliance inverse Head and shoulders.
Please comment on the charts and targets.
Inverse head and shoulders has broken out and Ascending triangle is yet to break out. Looks like reliance is getting ready for good move upside.
Vishy
| Description: |
|
| Filesize: |
200.33 KB |
| Viewed: |
205 Time(s) |
|
|
|
| Back to top |
|
 |
vishytns
White Belt

Joined: 26 Nov 2009
Posts: 206
|
Post: #778  Posted: Sat Dec 18, 2010 10:44 am Post subject: Posted: Sat Dec 18, 2010 10:44 am Post subject: |
 |
|
Reliance Inverse head and Shoulders.
| Description: |
|
| Filesize: |
185.78 KB |
| Viewed: |
213 Time(s) |
|
|
|
| Back to top |
|
 |
vishytns
White Belt

Joined: 26 Nov 2009
Posts: 206
|
Post: #779  Posted: Sat Dec 18, 2010 10:56 am Post subject: Posted: Sat Dec 18, 2010 10:56 am Post subject: |
 |
|
Casper/Sumesh,
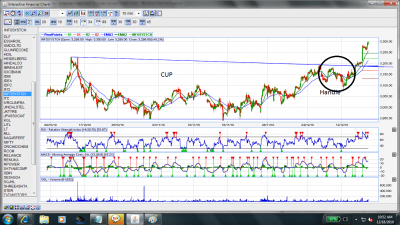
Cup and Handle formation in InfosysTCh, Actually this formation is seen even in IT index. I was not able to get the IT index chart.Break out has already happened.
Your comments and targets.
Vishy
| Description: |
|
| Filesize: |
233.64 KB |
| Viewed: |
203 Time(s) |
|
|
|
| Back to top |
|
 |
vishytns
White Belt

Joined: 26 Nov 2009
Posts: 206
|
Post: #780  Posted: Sat Dec 18, 2010 11:09 am Post subject: Posted: Sat Dec 18, 2010 11:09 am Post subject: |
 |
|
Casper/Sumesh,
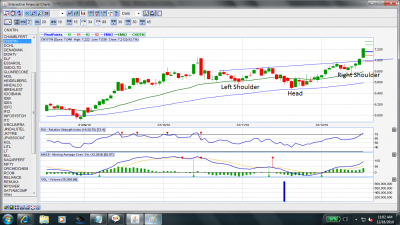
Inverse Head and Shoulders in CNXIT. Please provide your comments and targets.
Note: When ever a break out happens in inverse head and shoulders, i have seen there would be retracement to neck line again and price would take support at neck line price again will move up.
Even in the case of cup and handle u sould expect a retracement to cup and handle break out line. So u can place your trades accordingly.
Casper/Sumesh, Please let us know how to trade cup and handle, inverse head and shoulders.
Vishy
| Description: |
|
| Filesize: |
200.98 KB |
| Viewed: |
219 Time(s) |
|
|
|
| Back to top |
|
 |
|
|
You cannot post new topics in this forum
You cannot reply to topics in this forum
You cannot edit your posts in this forum
You cannot delete your posts in this forum
You cannot vote in polls in this forum
You can attach files in this forum
You can download files in this forum
|
Powered by phpBB © 2001, 2005 phpBB Group
|
|
|

