| View previous topic :: View next topic |
| Author |
a layman's approach to break out and break down |
vishytns
White Belt

Joined: 26 Nov 2009
Posts: 206
|
Post: #781  Posted: Sat Dec 18, 2010 11:27 am Post subject: Posted: Sat Dec 18, 2010 11:27 am Post subject: |
 |
|
Casper/Sumesh,
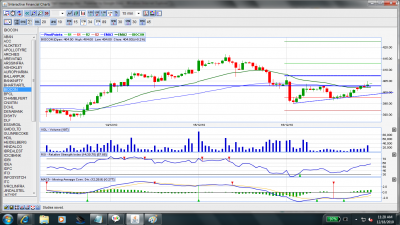
Looks like an AT in BIOCON. Please provide your comments.
Vishy
| Description: |
|
| Filesize: |
197.66 KB |
| Viewed: |
254 Time(s) |
|
|
|
| Back to top |
|
 |
|
|
 |
veerappan
Expert

Joined: 19 Dec 2007
Posts: 3680
|
Post: #782  Posted: Sat Dec 18, 2010 11:42 am Post subject: Posted: Sat Dec 18, 2010 11:42 am Post subject: |
 |
|
from my radar.....vishy its in buy only as per my view 403-404 ranges ...for intra sl 390....
anything taken-out of 422 ...then it will make new high that is 489-512 possibilities are more....
veeru
chennai boy 
|
|
| Back to top |
|
 |
vishytns
White Belt

Joined: 26 Nov 2009
Posts: 206
|
Post: #783  Posted: Sat Dec 18, 2010 11:50 am Post subject: Posted: Sat Dec 18, 2010 11:50 am Post subject: |
 |
|
Casper/Sumesh,
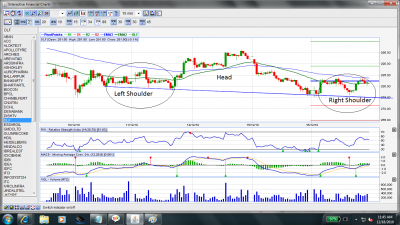
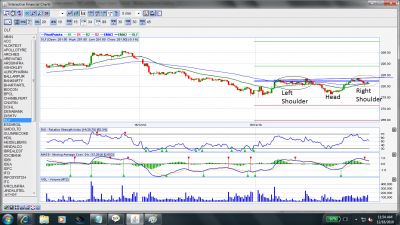
I have found two patterns in DLF
1. Head and shoulders in 15tf
2. Inverse Head and Shoulders in 5tf.
Check carefully and let us know your comments on both the charts. Attaching the 1 chart in this post. Second chart will follow in next post
Vishy.
| Description: |
|
| Filesize: |
194.53 KB |
| Viewed: |
261 Time(s) |
|
|
|
| Back to top |
|
 |
vishytns
White Belt

Joined: 26 Nov 2009
Posts: 206
|
Post: #784  Posted: Sat Dec 18, 2010 11:53 am Post subject: Posted: Sat Dec 18, 2010 11:53 am Post subject: |
 |
|
Attached chart is DLF inverse head and shoulders in 5tf.
Please Comment
Vishy
| Description: |
|
| Filesize: |
183.89 KB |
| Viewed: |
234 Time(s) |
|
|
|
| Back to top |
|
 |
vishytns
White Belt

Joined: 26 Nov 2009
Posts: 206
|
Post: #785  Posted: Sat Dec 18, 2010 11:59 am Post subject: Posted: Sat Dec 18, 2010 11:59 am Post subject: |
 |
|
Casper/Sumesh,
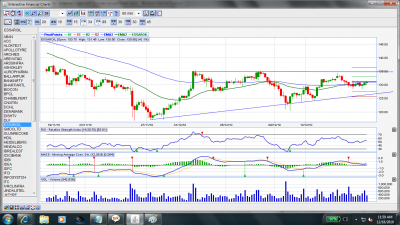
Please check Essar Oil 60tf, This is an AT. Provide your comments
Vishy
| Description: |
|
| Filesize: |
190.23 KB |
| Viewed: |
224 Time(s) |
|
|
|
| Back to top |
|
 |
vishytns
White Belt

Joined: 26 Nov 2009
Posts: 206
|
Post: #786  Posted: Sat Dec 18, 2010 12:19 pm Post subject: Posted: Sat Dec 18, 2010 12:19 pm Post subject: |
 |
|
Veeru Sir, Welcome to this thread. Great to get your comments in this thread. So we have got your attention  . .
Thanks for your comments on BIOCON and we have noted your points. 
Vishy
| veerappan wrote: | from my radar.....vishy its in buy only as per my view 403-404 ranges ...for intra sl 390....
anything taken-out of 422 ...then it will make new high that is 489-512 possibilities are more....
veeru
chennai boy  |
|
|
| Back to top |
|
 |
vishytns
White Belt

Joined: 26 Nov 2009
Posts: 206
|
Post: #787  Posted: Sat Dec 18, 2010 12:23 pm Post subject: Posted: Sat Dec 18, 2010 12:23 pm Post subject: |
 |
|
Casper/Sumesh,
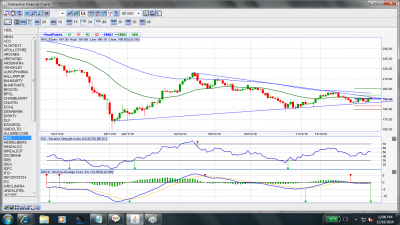
Symmteric Triangle in HDIL, bo/bd should happen very shortly. This should be stock to observe for comming days.
Provide your comments and targets in case of bo/bd
Vishy.
| Description: |
|
| Filesize: |
206.3 KB |
| Viewed: |
277 Time(s) |
|
|
|
| Back to top |
|
 |
vishytns
White Belt

Joined: 26 Nov 2009
Posts: 206
|
Post: #788  Posted: Sat Dec 18, 2010 12:28 pm Post subject: Posted: Sat Dec 18, 2010 12:28 pm Post subject: |
 |
|
Casper/Sumesh,
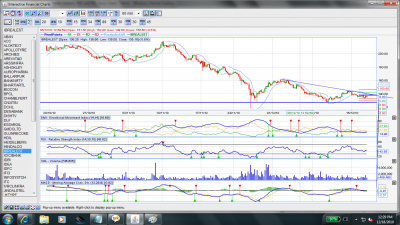
DT in IBREALEST, Please comment.
Vishy
| Description: |
|
| Filesize: |
218.21 KB |
| Viewed: |
299 Time(s) |
|
|
|
| Back to top |
|
 |
vishytns
White Belt

Joined: 26 Nov 2009
Posts: 206
|
Post: #789  Posted: Sat Dec 18, 2010 12:35 pm Post subject: Posted: Sat Dec 18, 2010 12:35 pm Post subject: |
 |
|
Casper/Sumesh,
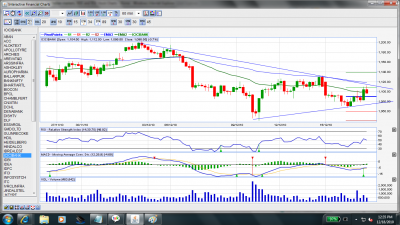
Symmetrical Triangle in ICICIBank. Please comment and provide the targets.
Vishy
| Description: |
|
| Filesize: |
209.18 KB |
| Viewed: |
268 Time(s) |
|
|
|
| Back to top |
|
 |
casper
Green Belt

Joined: 02 Oct 2010
Posts: 1315
|
Post: #790  Posted: Sat Dec 18, 2010 12:35 pm Post subject: Posted: Sat Dec 18, 2010 12:35 pm Post subject: |
 |
|
hii vishy its nice to see u back in forum
the results are as follows
1. as per 15 min chart, biocon was an at which broken out and it has almost reached its minimum target, now with the increased volume , we can expect it upto 410 max
2. infosystch it is not a classical cup and handle as the slope of cup and handle is not at par, but the essence of the pattern is here and that is most important for us. we can expect 3500 in coming days
3. ril is at and its at in 60 min too and here i got a problem. in 60 min we get a macd in sell mode with a big gap in histogram which is not going to be filled very easily, even if macd comes in bulls zone then also its likely to give a buy call on bo candle which will not be good for the bo, so i am a sort of suspicious about its nature, i follow 60 min closely so i know from my experience with the tf that this bo may not go long if macd turns buy in bo candle itself
4.for dlf, i better not to comment as seeing the divergence in rsi, CHROME has already posted it as a suitable case of NVK and according to KANNA, SAIKAT SIR also confirmed about it in SB, so i believe the contradictory view u r getting in 5min and 15 min tf is just due to that divergence, it will go up for sure and will nullify the head and shoulder pattern i hope
5.essar oil has a long way to go and i believe macd will surely turn bullish before it breaks out 135 level. target 145-150
|
|
| Back to top |
|
 |
casper
Green Belt

Joined: 02 Oct 2010
Posts: 1315
|
Post: #791  Posted: Sat Dec 18, 2010 12:37 pm Post subject: Posted: Sat Dec 18, 2010 12:37 pm Post subject: |
 |
|
| veerappan wrote: | from my radar.....vishy its in buy only as per my view 403-404 ranges ...for intra sl 390....
anything taken-out of 422 ...then it will make new high that is 489-512 possibilities are more....
veeru
chennai boy  |
welcome verru sir, its an honor to us that u visited and commented here 
|
|
| Back to top |
|
 |
casper
Green Belt

Joined: 02 Oct 2010
Posts: 1315
|
Post: #792  Posted: Sat Dec 18, 2010 12:42 pm Post subject: Posted: Sat Dec 18, 2010 12:42 pm Post subject: |
 |
|
| singh.ravee wrote: | Casper
Hello,
I am attaching eod chart of nifty spot.
1. I could see a double bottom formation in nifty spot around 5750 level marked by upward arrows.
2. Neckline of the pattern lies around 6015.
3. 50ema= 5950.
4. MACD is in buy mode.
4. If nifty moves up then it will be breaking 50 ema as well as neckline of pattern. In such scenario there will be double confirmation of the uptrend.
I think if pattern completes succesfully then one can think of going long on nifty above 6030 level for target of 6250 and sl= 6000. One has to adjust the nifty futures figures accordingly based upon the premium.
Kindly share your observation on attached chart.
Thanks and regards
ravee |
shall i reply in one sentence ravee???
u r absolutely right 
just watch out niftty at 5970 spot. if its breaks and sustain above it then the big descending triangle i posted earlier will be violated and nifty will find its upward motion. so u can add more longs after breaching this level also
|
|
| Back to top |
|
 |
vishytns
White Belt

Joined: 26 Nov 2009
Posts: 206
|
Post: #793  Posted: Sat Dec 18, 2010 12:50 pm Post subject: Posted: Sat Dec 18, 2010 12:50 pm Post subject: |
 |
|
Casper/Sumesh,
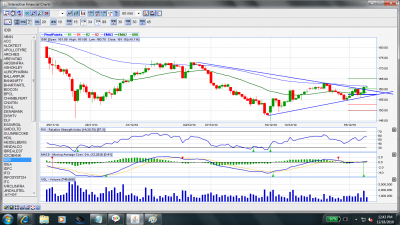
Check the IDBI chart, symmetrical triangle.
Please comment.
Vishy
| Description: |
|
| Filesize: |
207.74 KB |
| Viewed: |
252 Time(s) |
|
|
|
| Back to top |
|
 |
casper
Green Belt

Joined: 02 Oct 2010
Posts: 1315
|
Post: #794  Posted: Sat Dec 18, 2010 12:53 pm Post subject: Posted: Sat Dec 18, 2010 12:53 pm Post subject: |
 |
|
| vishytns wrote: | Casper/Sumesh,
Symmteric Triangle in HDIL, bo/bd should happen very shortly. This should be stock to observe for comming days.
Provide your comments and targets in case of bo/bd
Vishy. |
given the macd in buy mode and rsi is rising it is likely to broken out. however a few strongest resistance is ahead so we really need to wtch out what happens here.
according to me, we need to buy only above 206 as it will break almost all resistance then
|
|
| Back to top |
|
 |
casper
Green Belt

Joined: 02 Oct 2010
Posts: 1315
|
Post: #795  Posted: Sat Dec 18, 2010 12:57 pm Post subject: Posted: Sat Dec 18, 2010 12:57 pm Post subject: |
 |
|
| vishytns wrote: | Casper/Sumesh,
DT in IBREALEST, Please comment.
Vishy |
enter with a bd at 125 level. target should be around 110-110 level
|
|
| Back to top |
|
 |
|

