|
|
| View previous topic :: View next topic |
| Author |
a layman's approach to break out and break down |
casper
Green Belt

Joined: 02 Oct 2010
Posts: 1315
|
Post: #811  Posted: Sun Dec 19, 2010 8:28 pm Post subject: Posted: Sun Dec 19, 2010 8:28 pm Post subject: |
 |
|
| ragarwal wrote: | | if u see bajaj hindustan,i think it has a better chance of moving up.here d move can b upto 140,macd is into buy mode,plz giv ur comments.which is a better pick,bajaj or renuka. |
i would prefer renuka bcoz of a number of reasons. if i am to trade only one of these, i would trade renuka only
1. W in case of renuka is more prominent ,while bajaj hind is a little slopped showing weakness
2. renuka already crossed both 89/34 ema in eod chart which are hovering above bajaj hind and will provide much resistance
3.last candle in renuka is bullish one with added volume, but last candle in bajaj hind is bearish one and with increased volume. which may show as shorting by big boys at higher level and profit booking by players like u and me(its just my opinion, may not be true also)
so over all, i would prefer renuka
but one thing to mention. sugar, fertilizer, cotton and all these counters are known as news oriented counters. there is a new of allowing export of sugar by the government. this year we have a bumper sugar production, if by any means, govt stops its order then be prepared for a huge sell off in these stocks. working with these kinds of counters is not a very easy task, its very possible that bajaj hind may reach our target and gain even more. simply because of the logic that the company which will export more will gain more, so here only charting wont be of much help and we need to watch the news also
as u trade in commodities, have u noticed a sudden surge in price in cotton? thats was due a misinterpretation of a govt order, now all is cooling. so u can guess, how these types of stocks/commodities are affected by the news only and without any valid reason on the chart 
|
|
| Back to top |
|
 |
|
|  |
casper
Green Belt

Joined: 02 Oct 2010
Posts: 1315
|
|
| Back to top |
|
 |
casper
Green Belt

Joined: 02 Oct 2010
Posts: 1315
|
Post: #813  Posted: Sun Dec 19, 2010 9:07 pm Post subject: Posted: Sun Dec 19, 2010 9:07 pm Post subject: |
 |
|
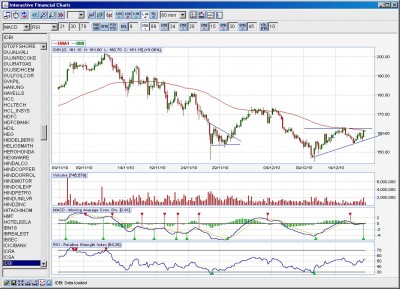
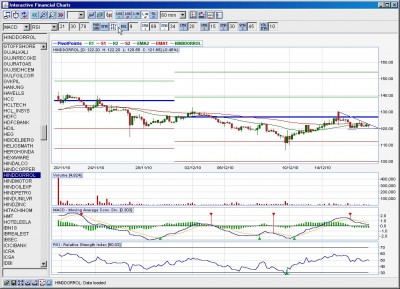
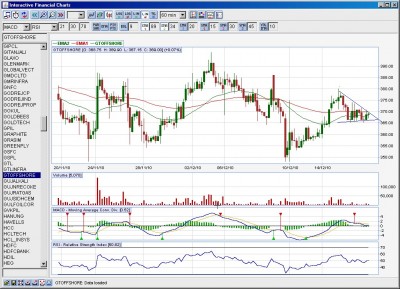
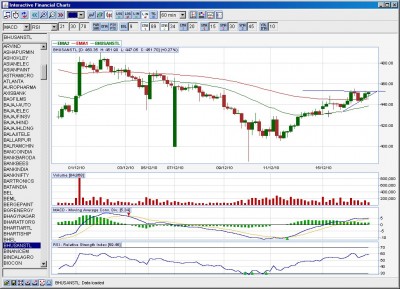
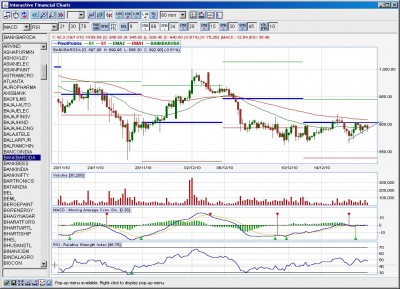
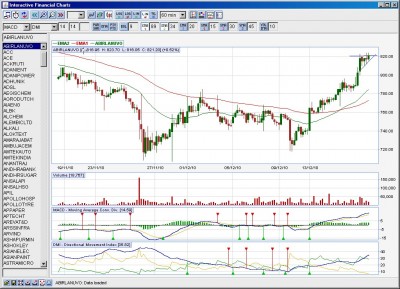
a few interesting charts as it appear to me 
1.abirlanuvo= buy at 820-823. target 830,840, sl 817
2.bank baroda= a tough resistance is seen between 900-911, buy above it and target 930.
3.bhusanstl = we can buy at cmp for 460 and if it sustains above 460, then target 475
4.gtoffshore = sell at 365. sl 370, target 360.355.350
5. hinddorol= sell below 120. sl 122. target 115.110
6.idbi= buy above 162. sl 155. target 165.170
i am writing about entry and sl only for those who dont have an access to real time chart. rt chart users are advised to enter with a bo/bd and keep a candle close below/ above break out level as per 60 min chart as ur sl
| Description: |
|
| Filesize: |
195.7 KB |
| Viewed: |
251 Time(s) |
|
| Description: |
|
| Filesize: |
194.76 KB |
| Viewed: |
238 Time(s) |
|
| Description: |
|
| Filesize: |
201.28 KB |
| Viewed: |
238 Time(s) |
|
| Description: |
|
| Filesize: |
192.52 KB |
| Viewed: |
263 Time(s) |
|
| Description: |
|
| Filesize: |
211.79 KB |
| Viewed: |
232 Time(s) |
|
| Description: |
|
| Filesize: |
201.7 KB |
| Viewed: |
237 Time(s) |
|
|
|
| Back to top |
|
 |
MANUBINDRA
White Belt

Joined: 12 Dec 2010
Posts: 28
|
Post: #814  Posted: Sun Dec 19, 2010 9:10 pm Post subject: Re: sterlite Posted: Sun Dec 19, 2010 9:10 pm Post subject: Re: sterlite |
 |
|
| thanks
|
|
| Back to top |
|
 |
sumesh_sol
Brown Belt

Joined: 06 Jun 2010
Posts: 2344
|
Post: #815  Posted: Sun Dec 19, 2010 9:40 pm Post subject: Posted: Sun Dec 19, 2010 9:40 pm Post subject: |
 |
|
| casper wrote: | a few interesting charts as it appear to me 
1.abirlanuvo= buy at 820-823. target 830,840, sl 817
2.bank baroda= a tough resistance is seen between 900-911, buy above it and target 930.
3.bhusanstl = we can buy at cmp for 460 and if it sustains above 460, then target 475
4.gtoffshore = sell at 365. sl 370, target 360.355.350
5. hinddorol= sell below 120. sl 122. target 115.110
6.idbi= buy above 162. sl 155. target 165.170
i am writing about entry and sl only for those who dont have an access to real time chart. rt chart users are advised to enter with a bo/bd and keep a candle close below/ above break out level as per 60 min chart as ur sl |
Wow, so much activity in such small time !!! phew…. Very difficult to follow…
Anyways, Vishy ! most of your queries have been answered by casper already and I really don’t have much to add…
Casper, beautiful setups…. Personally apart from IDBI and BankBaroda all looking good to me as well.. let’s see tomorrow….
Regards,
Sumesh
|
|
| Back to top |
|
 |
technocalls
White Belt

Joined: 27 Aug 2010
Posts: 34
|
Post: #816  Posted: Sun Dec 19, 2010 10:41 pm Post subject: tata steel Posted: Sun Dec 19, 2010 10:41 pm Post subject: tata steel |
 |
|
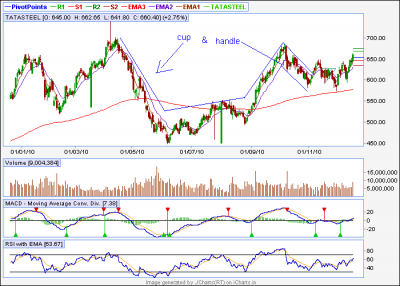
i m attaching tisco eod chart i thing its cup&handle formation made by tisco.. then what should be the bo level n what should be the targer and in what time it achive??? plz..... explain it also .....
| Description: |
|
| Filesize: |
28.54 KB |
| Viewed: |
228 Time(s) |
|
|
|
| Back to top |
|
 |
casper
Green Belt

Joined: 02 Oct 2010
Posts: 1315
|
Post: #817  Posted: Sun Dec 19, 2010 11:06 pm Post subject: Re: tata steel Posted: Sun Dec 19, 2010 11:06 pm Post subject: Re: tata steel |
 |
|
| technocalls wrote: | | i m attaching tisco eod chart i thing its cup&handle formation made by tisco.. then what should be the bo level n what should be the targer and in what time it achive??? plz..... explain it also ..... |
brother,
it will be totally cruelity from my side if i recommened u to searh the total thread to find the cup and handle description i have already provided 
so i am posting the stock in eod time frame to show u where is the bo level.
according to me bo should occur around 675 level with increased volume, and the macd should preferably be in buy mode
but at the end, i would surely recommend u to read the pattern descriptions which are posted in early pages of this thread, 
bcoz the handle u mentioned in ur post is not the full handle,it was a part of it. see the picture i am attaching for a better interpretation,
plz, if u have some time, read the past pages, i believe it will help u clear any doubt about pattern identification
nb: forgot to mention the target, target should be at least 850 after the break out, giving a time frame to achieve the target of this kind of high value bo is tough for me, but i hope it will considerably move within one month max from bo level
|
|
| Back to top |
|
 |
casper
Green Belt

Joined: 02 Oct 2010
Posts: 1315
|
|
| Back to top |
|
 |
drsureshbs
White Belt

Joined: 22 Oct 2008
Posts: 58
|
Post: #819  Posted: Mon Dec 20, 2010 12:12 am Post subject: Posted: Mon Dec 20, 2010 12:12 am Post subject: |
 |
|
| veerappan wrote: | casper sorry to enter in this forum....
suresh sehtty dont forget for any stock ....number 181 and 188....for your information...ster not able to cross this number...similarly u down load from nse website and filter this ...nearest points...u can go short.....with smaller risk.... if it crosses.... then buy for delivery picks.... in my radar now ADSL ...Godrej indu... Polaris... infinitie...hmvl...mothers& sumi..mayatas..choladbs...central bank....like this....
like this more numbers are there... so for i found some numbers only
once its over it will come .....upto that each and every number just note it in a note pad....intra day its very diff ..u can trade but not to carry.. .u have to watch in front of the system....but eod ....these numbers are going to be famous....in coming days.....crosses and closes above this take delivery...so last 20 min u have to watch this type of numbers...filter and put it in your screen....with volume if it crosses then fantastic.....for u i am saying each and every one knows head shoulder...double top ...rsi esi macd...try then new ...fine tune it..... all the best........
bye
veeru
chennai boy |
Thank you veeru sir....... sorry for being late
|
|
| Back to top |
|
 |
yawalkar
White Belt

Joined: 02 Oct 2010
Posts: 58
|
Post: #820  Posted: Mon Dec 20, 2010 7:36 am Post subject: Posted: Mon Dec 20, 2010 7:36 am Post subject: |
 |
|
| casper wrote: | | ragarwal wrote: | | if u see bajaj hindustan,i think it has a better chance of moving up.here d move can b upto 140,macd is into buy mode,plz giv ur comments.which is a better pick,bajaj or renuka. |
i would prefer renuka bcoz of a number of reasons. if i am to trade only one of these, i would trade renuka only
1. W in case of renuka is more prominent ,while bajaj hind is a little slopped showing weakness
2. renuka already crossed both 89/34 ema in eod chart which are hovering above bajaj hind and will provide much resistance
3.last candle in renuka is bullish one with added volume, but last candle in bajaj hind is bearish one and with increased volume. which may show as shorting by big boys at higher level and profit booking by players like u and me(its just my opinion, may not be true also)
so over all, i would prefer renuka
but one thing to mention. sugar, fertilizer, cotton and all these counters are known as news oriented counters. there is a new of allowing export of sugar by the government. this year we have a bumper sugar production, if by any means, govt stops its order then be prepared for a huge sell off in these stocks. working with these kinds of counters is not a very easy task, its very possible that bajaj hind may reach our target and gain even more. simply because of the logic that the company which will export more will gain more, so here only charting wont be of much help and we need to watch the news also
as u trade in commodities, have u noticed a sudden surge in price in cotton? thats was due a misinterpretation of a govt order, now all is cooling. so u can guess, how these types of stocks/commodities are affected by the news only and without any valid reason on the chart  |
Dear Casper,
Very nice explanation. Thanks for such a wonderful knowledge.
|
|
| Back to top |
|
 |
ragarwal
Yellow Belt

Joined: 16 Nov 2008
Posts: 582
|
Post: #821  Posted: Mon Dec 20, 2010 8:03 am Post subject: Posted: Mon Dec 20, 2010 8:03 am Post subject: |
 |
|
| thnx casper fr explaining it so well
|
|
| Back to top |
|
 |
yawalkar
White Belt

Joined: 02 Oct 2010
Posts: 58
|
Post: #822  Posted: Mon Dec 20, 2010 8:13 am Post subject: Posted: Mon Dec 20, 2010 8:13 am Post subject: |
 |
|
Dear Casper,
pls. give your views about herohonda & TCS
What will be probable move up-down with tgts pls..
|
|
| Back to top |
|
 |
casper
Green Belt

Joined: 02 Oct 2010
Posts: 1315
|
Post: #823  Posted: Mon Dec 20, 2010 8:42 am Post subject: Posted: Mon Dec 20, 2010 8:42 am Post subject: |
 |
|
| yawalkar wrote: | Dear Casper,
pls. give your views about herohonda & TCS
What will be probable move up-down with tgts pls.. |
as per rt chart 60 min, hero honda has a resistance at the closing price of last candle. its 34 ema. above which it will be good for intra
as per eod chart. it has a white candle with increased vol, so w can consider this for btst also
in that case we can have a target of 1750.1815 in coming days, though no particular pattern is seen
tcs i already replied to vishy, he has posted the chart also, pl take a look of his posted chart, but the results should be as follows
tcs has a cup and handle formation. now we can expect atleast 1200, cmp is 1140 or so now, if it retrace to bo level viz 1100 level u can add more longs for btst, in that case u can keep a strong close below 1100 level as ur stop loss, and if it does not retrace, u can buy in small qty with sl as per ur risk appetite
|
|
| Back to top |
|
 |
technocalls
White Belt

Joined: 27 Aug 2010
Posts: 34
|
Post: #824  Posted: Mon Dec 20, 2010 10:08 am Post subject: Posted: Mon Dec 20, 2010 10:08 am Post subject: |
 |
|
| thanx 4 the reply.... casper... i will refr previous pages for the pattern
|
|
| Back to top |
|
 |
sumesh_sol
Brown Belt

Joined: 06 Jun 2010
Posts: 2344
|
Post: #825  Posted: Mon Dec 20, 2010 10:46 am Post subject: MCLEODRUSS Posted: Mon Dec 20, 2010 10:46 am Post subject: MCLEODRUSS |
 |
|
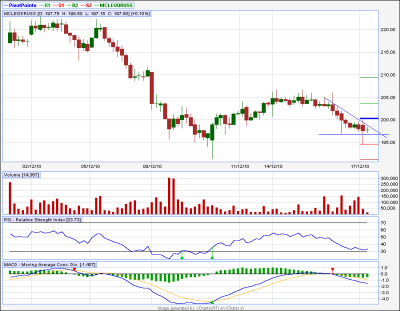
MCLEODRUSS .. 60tf
********************
Looking weak.. Can be shorted on BD .. Tgt can be 191/188.
-Sumesh
| Description: |
|
| Filesize: |
16.36 KB |
| Viewed: |
239 Time(s) |
|
|
|
| Back to top |
|
 |
|
|
You cannot post new topics in this forum
You cannot reply to topics in this forum
You cannot edit your posts in this forum
You cannot delete your posts in this forum
You cannot vote in polls in this forum
You can attach files in this forum
You can download files in this forum
|
Powered by phpBB © 2001, 2005 phpBB Group
|
|
|

