| View previous topic :: View next topic |
| Author |
a layman's approach to break out and break down |
casper
Green Belt

Joined: 02 Oct 2010
Posts: 1315
|
Post: #856  Posted: Wed Dec 22, 2010 11:03 pm Post subject: Posted: Wed Dec 22, 2010 11:03 pm Post subject: |
 |
|
the problem wid hdil is , apart from being sym.tri, it has both supports and resisatnce in both the sides
specially in 60 min real time tf. it has too much resistance.
wait for an actual bo/bd. it may go anywhere
apollotyre got rejected from the monthly pivot and in rt chart, closed below the weekly pivot. here a bd seems to me more likely
apil. in spite of being st in eod chart, the stock in forming( not completed yet) an at in 60 min real time. i think it will give us some break out
|
|
| Back to top |
|
 |
|
|
 |
casper
Green Belt

Joined: 02 Oct 2010
Posts: 1315
|
Post: #857  Posted: Wed Dec 22, 2010 11:12 pm Post subject: Posted: Wed Dec 22, 2010 11:12 pm Post subject: |
 |
|
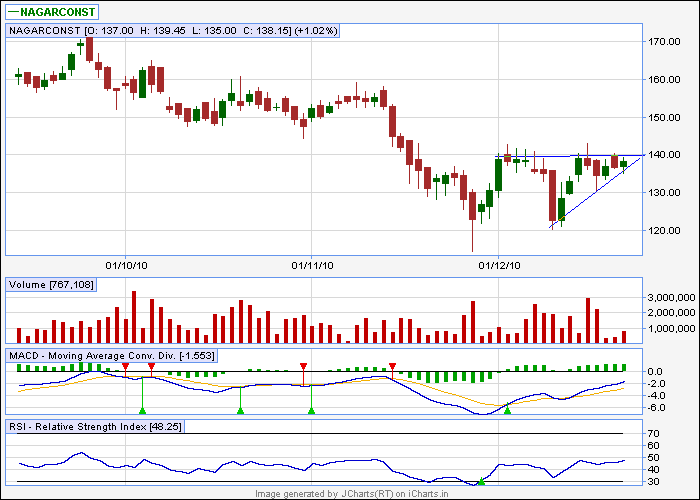
for btst or short term, u can consider nagarconst also
it has formed a.t in eod chart, where target will be 145.160, the cmp is 138, its a f&o scrip so u can take position if it breaks out successfully
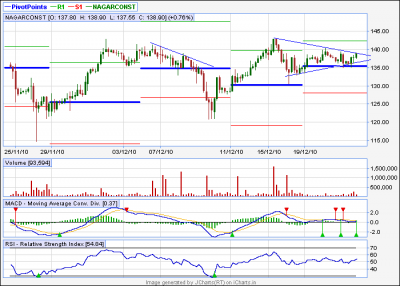
it has formed a sort of st in 60 min tf . which has favorable macd and rsi signals. for intraday we can target 142,145 after a bo
| Description: |
|
| Filesize: |
10.3 KB |
| Viewed: |
1129 Time(s) |
|
| Description: |
|
| Filesize: |
13.5 KB |
| Viewed: |
250 Time(s) |
|
|
|
| Back to top |
|
 |
yawalkar
White Belt

Joined: 02 Oct 2010
Posts: 58
|
Post: #858  Posted: Thu Dec 23, 2010 8:21 am Post subject: drreddy Posted: Thu Dec 23, 2010 8:21 am Post subject: drreddy |
 |
|
casper,
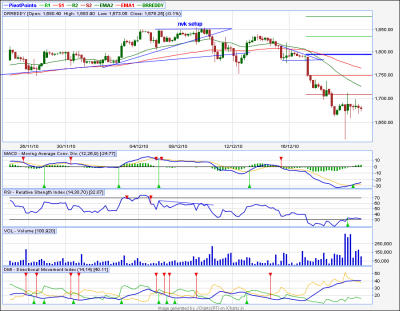
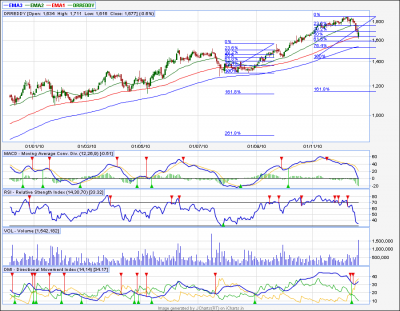
can u guide abt drreddy. Why it is falling? on eod last time it is corrected till 50%.
Is it just correction or any other else?
pls. guide about tgt?
| Description: |
|
| Filesize: |
47.64 KB |
| Viewed: |
230 Time(s) |
|
| Description: |
|
| Filesize: |
52.06 KB |
| Viewed: |
225 Time(s) |
|
|
|
| Back to top |
|
 |
casper
Green Belt

Joined: 02 Oct 2010
Posts: 1315
|
Post: #859  Posted: Thu Dec 23, 2010 9:09 am Post subject: Posted: Thu Dec 23, 2010 9:09 am Post subject: |
 |
|
i saw it in hurry as market is opening and i am yet to be ready. 
at a glance. apart from a dt in 60min , nothing seems to me as a cause of the bd. but it was a severe correction. i think due to a high bull charge, it was almost certain to be broken down someday. it happened,
now the good news is we got a very big vol with a green candle yesterday. may be a relief rally is on the card
in case of a rally. 1700 and 1750 will be my target, as 1700 is the lower bb and 1745 is 34ema in eod chart. if it sustain above 1750, then 1850 can be our next target. but in case of a further downfall from here, i mean from present level, i see a support only at 1550 level
as i wrote, tht i am writing in a hurry, i will add if any thing i find later
|
|
| Back to top |
|
 |
sumesh_sol
Brown Belt

Joined: 06 Jun 2010
Posts: 2344
|
Post: #860  Posted: Thu Dec 23, 2010 9:30 am Post subject: RECLTD.. 60tf.. Posted: Thu Dec 23, 2010 9:30 am Post subject: RECLTD.. 60tf.. |
 |
|
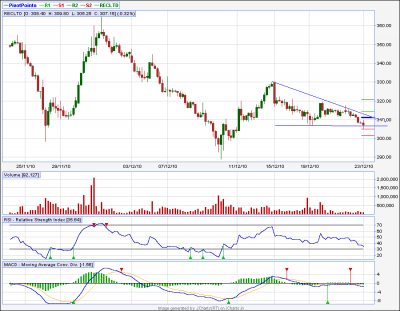
RECLTD.. 60tf..
*****************
Break below 301 (weekly R1) can take it to 292..
-Sumesh
| Description: |
|
| Filesize: |
18.8 KB |
| Viewed: |
246 Time(s) |
|
|
|
| Back to top |
|
 |
sumesh_sol
Brown Belt

Joined: 06 Jun 2010
Posts: 2344
|
Post: #861  Posted: Thu Dec 23, 2010 10:23 am Post subject: TVSMOTOR .. 60tf.. Posted: Thu Dec 23, 2010 10:23 am Post subject: TVSMOTOR .. 60tf.. |
 |
|
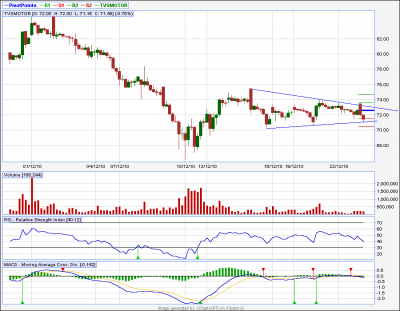
TVSMOTOR .. 60tf..
*************************
Below 70.8 can be 69/67.8
-Sumesh
| Description: |
|
| Filesize: |
17.64 KB |
| Viewed: |
232 Time(s) |
|
|
|
| Back to top |
|
 |
yawalkar
White Belt

Joined: 02 Oct 2010
Posts: 58
|
Post: #862  Posted: Thu Dec 23, 2010 10:50 am Post subject: Posted: Thu Dec 23, 2010 10:50 am Post subject: |
 |
|
| casper wrote: | i saw it in hurry as market is opening and i am yet to be ready. 
at a glance. apart from a dt in 60min , nothing seems to me as a cause of the bd. but it was a severe correction. i think due to a high bull charge, it was almost certain to be broken down someday. it happened,
now the good news is we got a very big vol with a green candle yesterday. may be a relief rally is on the card
in case of a rally. 1700 and 1750 will be my target, as 1700 is the lower bb and 1745 is 34ema in eod chart. if it sustain above 1750, then 1850 can be our next target. but in case of a further downfall from here, i mean from present level, i see a support only at 1550 level
as i wrote, tht i am writing in a hurry, i will add if any thing i find later |
Dear Casper,
Thanks for u r reply.
I want to know how you give support at 1550 lvl.? what are the indicators or theory. Also give details for tgt 1700 lower (bb) what is this? i don't understand this. for 1850 what t.a. u have done? can u explain pls. take your time. i don't have any hurry. I just taken this stock for study.
|
|
| Back to top |
|
 |
sumesh_sol
Brown Belt

Joined: 06 Jun 2010
Posts: 2344
|
|
| Back to top |
|
 |
casper
Green Belt

Joined: 02 Oct 2010
Posts: 1315
|
Post: #864  Posted: Thu Dec 23, 2010 11:28 am Post subject: Re: Nifty.. 60 tf... Posted: Thu Dec 23, 2010 11:28 am Post subject: Re: Nifty.. 60 tf... |
 |
|
| sumesh_sol wrote: | A BD can take it to 5935-5930 levels  |
i am adding a few lines brother.strong support is seen below the dt line
1. monthly piv
2.89ema and
3.34 ema
it looks like strong, preferably some news basic sell off is needed to break this dt. i mean panic selling. or else, we may see a 3rd class choppy day

|
|
| Back to top |
|
 |
sumesh_sol
Brown Belt

Joined: 06 Jun 2010
Posts: 2344
|
Post: #865  Posted: Thu Dec 23, 2010 12:10 pm Post subject: ORIENTBANK.. 60tf.. Posted: Thu Dec 23, 2010 12:10 pm Post subject: ORIENTBANK.. 60tf.. |
 |
|
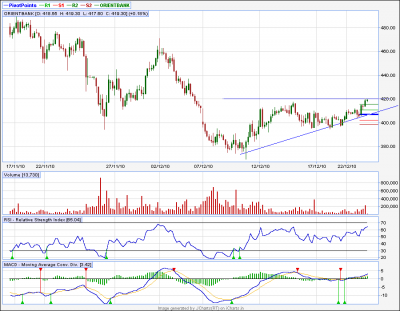
ORIENTBANK.. 60tf..
********************
BO above 420 possible..
tgt 426/432/455
-Sumesh
| Description: |
|
| Filesize: |
20.51 KB |
| Viewed: |
238 Time(s) |
|
|
|
| Back to top |
|
 |
casper
Green Belt

Joined: 02 Oct 2010
Posts: 1315
|
Post: #866  Posted: Thu Dec 23, 2010 12:39 pm Post subject: Posted: Thu Dec 23, 2010 12:39 pm Post subject: |
 |
|
| yawalkar wrote: | | casper wrote: | i saw it in hurry as market is opening and i am yet to be ready. 
at a glance. apart from a dt in 60min , nothing seems to me as a cause of the bd. but it was a severe correction. i think due to a high bull charge, it was almost certain to be broken down someday. it happened,
now the good news is we got a very big vol with a green candle yesterday. may be a relief rally is on the card
in case of a rally. 1700 and 1750 will be my target, as 1700 is the lower bb and 1745 is 34ema in eod chart. if it sustain above 1750, then 1850 can be our next target. but in case of a further downfall from here, i mean from present level, i see a support only at 1550 level
as i wrote, tht i am writing in a hurry, i will add if any thing i find later |
Dear Casper,
Thanks for u r reply.
I want to know how you give support at 1550 lvl.? what are the indicators or theory. Also give details for tgt 1700 lower (bb) what is this? i don't understand this. for 1850 what t.a. u have done? can u explain pls. take your time. i don't have any hurry. I just taken this stock for study. |
now it seems that i have atleast one hour in my hand before i start up any thing. so i am replying u with calmness 
1550 is the 100% fib retracement level of previous upmove as per ichart premium( the free fixed flash chart-3f chart!!!!  ) )
to be precise, the level is 1567, not 1550. as the corrective moves almost broken every level and its equally true that due to a heavy bull run, not much support were there. so the only ray of hope is 1550 level of fib to provide any support. so i told u that if the current level is further broken, then we got a support around 1550
the lower bb means the lower bolinger band. bollinger band(bb) is a continuous band which shows immediate strong support and resistance
in my experience i have noticed that lower or upper bb can not be broken very easily without a bd or bo respectively
whenever this lower or upper band is broken, we generally get very strong movements
to know how it works, u just add the bollinger band in the fash chart eod{charts(premium)} as one of the upper indicators and see how it has given support and resistance
in case of drreddy. we have broken lower bb during correction, so in order to go up, this lower bb will provide strong resistance to any upmove until it gets breached by closing. after getting breached, it will be the strongest support available
if u need to learn more about bb and how to use it in positional trading, go to the link below. this strategy is proposed by a senior trader. named trade.master. this one helped me alot to understand how to take positions in a choppy market and yet making good gains
but my only sorrow is. though i have reffred it to almost evryone whoever came to my touch. no body seems to me , gave any importance to it 
the link is http://www.icharts.in/forum/swing-trades-based-on-modified-bb-and-rsi-t1742.html
see if it helps u any way

|
|
| Back to top |
|
 |
sumesh_sol
Brown Belt

Joined: 06 Jun 2010
Posts: 2344
|
Post: #867  Posted: Thu Dec 23, 2010 1:41 pm Post subject: ASHOKLEY Posted: Thu Dec 23, 2010 1:41 pm Post subject: ASHOKLEY |
 |
|
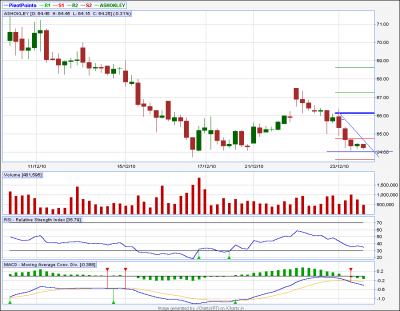
ASHOKLEY
**********
63 is the Monthly S1, below this it can give decent movement...
-Sumesh
| Description: |
|
| Filesize: |
14.91 KB |
| Viewed: |
216 Time(s) |
|
|
|
| Back to top |
|
 |
vrushabh123
White Belt

Joined: 18 Nov 2010
Posts: 39
|
Post: #868  Posted: Thu Dec 23, 2010 2:27 pm Post subject: hiii Posted: Thu Dec 23, 2010 2:27 pm Post subject: hiii |
 |
|
| hiii casper i m bit confused for Maruti in EOD is a A.T OR invert H & S..h&s is visible if u see line chart...Wht is it accc to u.. pl suggest..
|
|
| Back to top |
|
 |
sumesh_sol
Brown Belt

Joined: 06 Jun 2010
Posts: 2344
|
Post: #869  Posted: Thu Dec 23, 2010 2:37 pm Post subject: JINDRILL.. EOD.. Posted: Thu Dec 23, 2010 2:37 pm Post subject: JINDRILL.. EOD.. |
 |
|
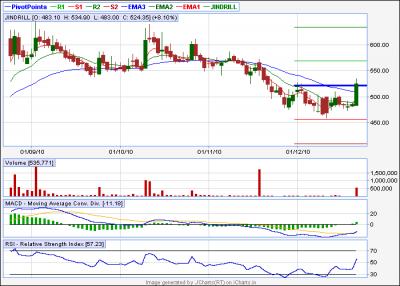
JINDRILL.. EOD..
******************
EOD chart..(not updated for today..) Looking very good.. next tgt is 568... I just went long in it at 536.. (for delivery)
-Sumesh
| Description: |
|
| Filesize: |
11.98 KB |
| Viewed: |
216 Time(s) |
|
|
|
| Back to top |
|
 |
sumesh_sol
Brown Belt

Joined: 06 Jun 2010
Posts: 2344
|
Post: #870  Posted: Thu Dec 23, 2010 2:54 pm Post subject: ARVIND .. EOD Posted: Thu Dec 23, 2010 2:54 pm Post subject: ARVIND .. EOD |
 |
|
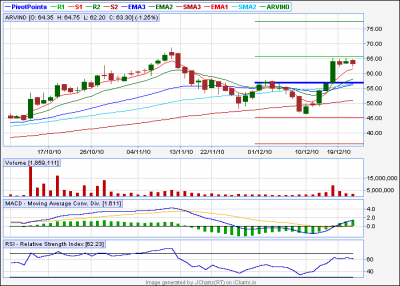
ARVIND .. EOD
***********
Broken out after 3-4 days consolidation at the top.. next target could be 70 & 77 (for delivery).. I bought it on 66 today...
-Sumesh
| Description: |
|
| Filesize: |
13.23 KB |
| Viewed: |
236 Time(s) |
|
|
|
| Back to top |
|
 |
|

