|
|
| View previous topic :: View next topic |
| Author |
a layman's approach to break out and break down |
girishhu1
White Belt

Joined: 17 Aug 2009
Posts: 316
|
Post: #871  Posted: Thu Dec 23, 2010 5:22 pm Post subject: Posted: Thu Dec 23, 2010 5:22 pm Post subject: |
 |
|
| casper wrote: | | yawalkar wrote: | | casper wrote: | i saw it in hurry as market is opening and i am yet to be ready. 
at a glance. apart from a dt in 60min , nothing seems to me as a cause of the bd. but it was a severe correction. i think due to a high bull charge, it was almost certain to be broken down someday. it happened,
now the good news is we got a very big vol with a green candle yesterday. may be a relief rally is on the card
in case of a rally. 1700 and 1750 will be my target, as 1700 is the lower bb and 1745 is 34ema in eod chart. if it sustain above 1750, then 1850 can be our next target. but in case of a further downfall from here, i mean from present level, i see a support only at 1550 level
as i wrote, tht i am writing in a hurry, i will add if any thing i find later |
Dear Casper,
Thanks for u r reply.
I want to know how you give support at 1550 lvl.? what are the indicators or theory. Also give details for tgt 1700 lower (bb) what is this? i don't understand this. for 1850 what t.a. u have done? can u explain pls. take your time. i don't have any hurry. I just taken this stock for study. |
now it seems that i have atleast one hour in my hand before i start up any thing. so i am replying u with calmness 
1550 is the 100% fib retracement level of previous upmove as per ichart premium( the free fixed flash chart-3f chart!!!!  ) )
to be precise, the level is 1567, not 1550. as the corrective moves almost broken every level and its equally true that due to a heavy bull run, not much support were there. so the only ray of hope is 1550 level of fib to provide any support. so i told u that if the current level is further broken, then we got a support around 1550
the lower bb means the lower bolinger band. bollinger band(bb) is a continuous band which shows immediate strong support and resistance
in my experience i have noticed that lower or upper bb can not be broken very easily without a bd or bo respectively
whenever this lower or upper band is broken, we generally get very strong movements
to know how it works, u just add the bollinger band in the fash chart eod{charts(premium)} as one of the upper indicators and see how it has given support and resistance
in case of drreddy. we have broken lower bb during correction, so in order to go up, this lower bb will provide strong resistance to any upmove until it gets breached by closing. after getting breached, it will be the strongest support available
if u need to learn more about bb and how to use it in positional trading, go to the link below. this strategy is proposed by a senior trader. named trade.master. this one helped me alot to understand how to take positions in a choppy market and yet making good gains
but my only sorrow is. though i have reffred it to almost evryone whoever came to my touch. no body seems to me , gave any importance to it 
the link is http://www.icharts.in/forum/swing-trades-based-on-modified-bb-and-rsi-t1742.html
see if it helps u any way
 |
hi casperji,
your reply to yavalkar has given answer to my question, posted to in stock calls thread. thank you very much.
regards,
girish
|
|
| Back to top |
|
 |
|
|  |
casper
Green Belt

Joined: 02 Oct 2010
Posts: 1315
|
Post: #872  Posted: Thu Dec 23, 2010 6:25 pm Post subject: Posted: Thu Dec 23, 2010 6:25 pm Post subject: |
 |
|
hiii girish bhaiya. nice to see u back in our forum 
yes i have seen ur question, perhaps u have asked about strerlite ind or sterlingbio. 
u know the most admirable thing i have noticed in u that u r always open to new concepts and u always try to learn good things and try to apply it in ur trading
me also learned whatever lil bit t.a.i know like u, by asking questions and applying the theories. i am sure that our progress will never be stopped if we keep learning, applying and then sharing the knowledge with others .
wish u more success in ur trading
casper

|
|
| Back to top |
|
 |
casper
Green Belt

Joined: 02 Oct 2010
Posts: 1315
|
Post: #873  Posted: Thu Dec 23, 2010 7:01 pm Post subject: Re: hiii Posted: Thu Dec 23, 2010 7:01 pm Post subject: Re: hiii |
 |
|
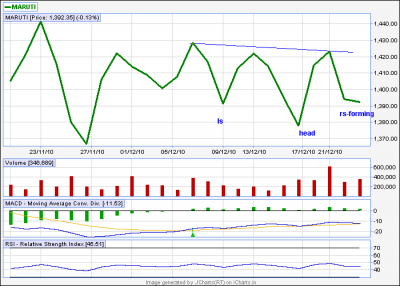
| vrushabh123 wrote: | | hiii casper i m bit confused for Maruti in EOD is a A.T OR invert H & S..h&s is visible if u see line chart...Wht is it accc to u.. pl suggest.. |
hiii vrushabh123.
the first thing u will provide me is a name or nick name by which i can call u. vrushabh is good one, but my prb is i cant pronounce it properly. and if u cant pronounce ur brother's name, it hurts 
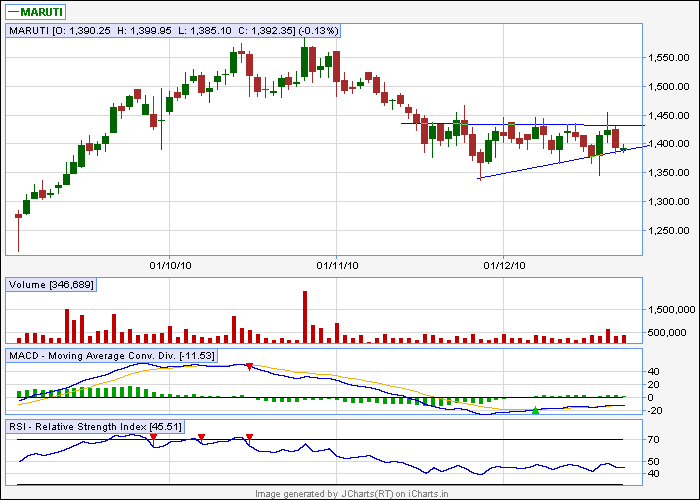
now let us jump to maruti (not car, but chart  ) )
i hv seen two set of formations, none of them are perfect one. but one set is formed over a few days and smaller.
another set is bigger one, formed over a very long time,
in case of the smaller inv h.s or a.t, the neck line is 1450, and in case of bigger, inv.h/s or a.t , the neck line is 1550
however that is not the problem here, problem is whether it is inv h/s or an a.t
let us say, EVERY, i repeat, EVERY inverted head and shoulder pattern has got an ascending triangle in it, sounds surprising?, just try to imagine ANY inv.h/s and try to draw a trend line from inverted head to right shoulder and increase it to intersect the neck line, each time u will see that u have got an ascending triangle within the inverted head and shoulder pattern
just like that, every head and shoulder has a descending triangle, just connect the head and right shoulder and increase the line to intersect the neck line, u will get a descending triangle every time
now among the two sets i am posting the smaller set for u
see what looks like as an a.t in candle stick can also be recognized as inv.h/s where the r.s is forming
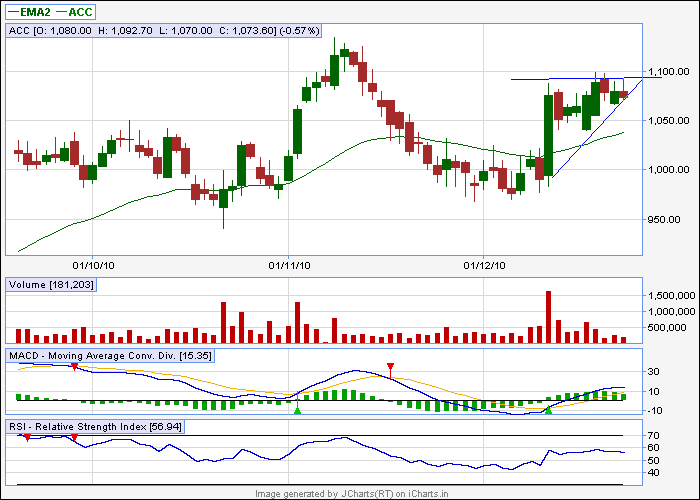
as far as acc is concerned, i will call it a.t.
where a break out above 1100 is needed to reach atleast 1150,1200 level.
i am attaching that chart also
finally, one thing i would like to mention. inverted h/s and ascending triangle, OR, h/s and descending triangle. are of same type pattern. bcoz.
both invh/s and a.t is bullish and h/s and d.t is bearish. so it wont have any effect on our trading decision. once we get a break we enter so things will be more or less same
| Description: |
|
| Filesize: |
10.67 KB |
| Viewed: |
1628 Time(s) |
|
| Description: |
|
| Filesize: |
10.09 KB |
| Viewed: |
1628 Time(s) |
|
| Description: |
|
| Filesize: |
12 KB |
| Viewed: |
254 Time(s) |
|
|
|
| Back to top |
|
 |
vrushabh123
White Belt

Joined: 18 Nov 2010
Posts: 39
|
Post: #874  Posted: Thu Dec 23, 2010 8:11 pm Post subject: hiiiii Posted: Thu Dec 23, 2010 8:11 pm Post subject: hiiiii |
 |
|
hey THANKS dear for such lovely explanation... 
Well u can call me simply RUSHABH... Vrushabh is modified one..But i know its unique  ( thank u ... thank u.. i know u like it ).. ( thank u ... thank u.. i know u like it ).. 
I understood wht u wrote,in any case we can say v r bullish on Maruti..so just wait for B.O..U know best thing of urs is u r always ready to help others...Apart from them u understand in very simple language,thts the highlight.... GREAT 
ALWAYS KEEP THIS GOING...
|
|
| Back to top |
|
 |
vishytns
White Belt

Joined: 26 Nov 2009
Posts: 206
|
Post: #875  Posted: Thu Dec 23, 2010 8:41 pm Post subject: Posted: Thu Dec 23, 2010 8:41 pm Post subject: |
 |
|
All,
Great team effort in understanding the techincal patterns. I wish all of u become techincal analysts in future. Its really great to be part of this team/thread.
Each one of u contribute to the success of this thread.
Great work buddies...Grow rich, happier and healthy.

Vishy
|
|
| Back to top |
|
 |
deepakms
White Belt

Joined: 13 Aug 2009
Posts: 194
|
Post: #876  Posted: Thu Dec 23, 2010 9:41 pm Post subject: Posted: Thu Dec 23, 2010 9:41 pm Post subject: |
 |
|
hi Sumesh/Casper,
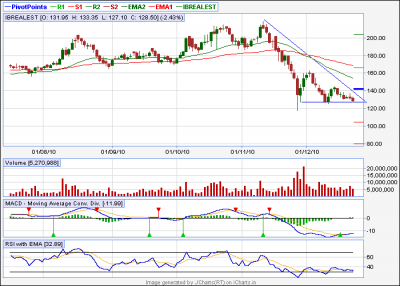
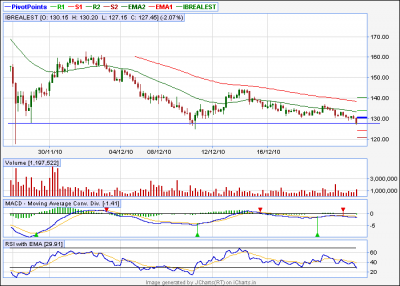
pls give ur views of IBREALEST ......on 60Tf looks bearish ,but a BUY on macd on the daily.
thnx/rgds
deeppak
| Description: |
|
| Filesize: |
13.41 KB |
| Viewed: |
236 Time(s) |
|
| Description: |
|
| Filesize: |
13.26 KB |
| Viewed: |
282 Time(s) |
|
|
|
| Back to top |
|
 |
mrvishal_g
White Belt

Joined: 17 Sep 2010
Posts: 89
|
Post: #877  Posted: Thu Dec 23, 2010 9:50 pm Post subject: Re: FSL..(eod) Posted: Thu Dec 23, 2010 9:50 pm Post subject: Re: FSL..(eod) |
 |
|
| mrvishal_g wrote: | | sumesh_sol wrote: | FSL..(eod)
**********
FSL has made 23.35 high.. which is along with risen volume... I shall buy it either above 23.4 or at the end if it remains above 23... whichever comes first for delivery....
This is AT BO case.
-Sumesh |
Hi Sumesh,
I bought FSL @23.4 and take delivery boz it was showing strenth in last 10 minutes. Let see what happened tom.
Vishal |
Hi Sumesh,......i sold 50% @24.4 and having 1000 for 25.75-------26. Please suggest your view. I like your JindalDrill and Arvind also for tom trade....thanks brother....Vishal
|
|
| Back to top |
|
 |
mrvishal_g
White Belt

Joined: 17 Sep 2010
Posts: 89
|
Post: #878  Posted: Thu Dec 23, 2010 9:53 pm Post subject: Re: hiiiii Posted: Thu Dec 23, 2010 9:53 pm Post subject: Re: hiiiii |
 |
|
| vrushabh123 wrote: | hey THANKS dear for such lovely explanation... 
Well u can call me simply RUSHABH... Vrushabh is modified one..But i know its unique  ( thank u ... thank u.. i know u like it ).. ( thank u ... thank u.. i know u like it ).. 
I understood wht u wrote,in any case we can say v r bullish on Maruti..so just wait for B.O..U know best thing of urs is u r always ready to help others...Apart from them u understand in very simple language,thts the highlight.... GREAT 
ALWAYS KEEP THIS GOING... |
I would like to add a line........."CASPER JAISA KOI NAHI"
Vishal
|
|
| Back to top |
|
 |
casper
Green Belt

Joined: 02 Oct 2010
Posts: 1315
|
Post: #879  Posted: Thu Dec 23, 2010 11:37 pm Post subject: Posted: Thu Dec 23, 2010 11:37 pm Post subject: |
 |
|
| deepakms wrote: | hi Sumesh/Casper,
pls give ur views of IBREALEST ......on 60Tf looks bearish ,but a BUY on macd on the daily.
thnx/rgds
deeppak |
hiii deepak.
check the macd histogram in eod. its buy in eod but histogram is very thin, it looks like with another red candle, this macd will turn to be bearish one. so that does not matter much.
again, around 120. we got weekly r2, it is also possible to go down up to 120 then getting the support, start moving up..
again. the stock is also at the lower level of bolinger band, hence it will get solid support around this zone and wont go down much
besides.rsi is making divergence, though not very noticeable, still some divergence, bullish divergence is here
i am not sure if it qualifies as NVK, but due to that divergence. we can expect some upward movements
over all, the chance of going up is seems to be higher, now if this stock qualifies as nvk in eod, then it will surely go up
and among us,only sumesh can confirm whether this is nvk or not
sumesh ji,    , brother, plz shed some light here , brother, plz shed some light here
|
|
| Back to top |
|
 |
casper
Green Belt

Joined: 02 Oct 2010
Posts: 1315
|
Post: #880  Posted: Fri Dec 24, 2010 12:23 am Post subject: Posted: Fri Dec 24, 2010 12:23 am Post subject: |
 |
|
hi rushabh, vishy,vishal and all of my brothers and sisters
thanks for ur kind words and ur support, and whats more, ur affection, which i get here
along with u, i am also learning T.A and gathering exp day by day
and i am sure that in near future, we will surely reach to the top 
|
|
| Back to top |
|
 |
yawalkar
White Belt

Joined: 02 Oct 2010
Posts: 58
|
Post: #881  Posted: Fri Dec 24, 2010 8:05 am Post subject: Posted: Fri Dec 24, 2010 8:05 am Post subject: |
 |
|
| casper wrote: | hi rushabh, vishy,vishal and all of my brothers and sisters
thanks for ur kind words and ur support, and whats more, ur affection, which i get here
along with u, i am also learning T.A and gathering exp day by day
and i am sure that in near future, we will surely reach to the top  |
Our best wishes are always with u brother...hit the mkt as per u r way    and make everyone happy and make everyone happy     
|
|
| Back to top |
|
 |
yawalkar
White Belt

Joined: 02 Oct 2010
Posts: 58
|
Post: #882  Posted: Fri Dec 24, 2010 8:10 am Post subject: Posted: Fri Dec 24, 2010 8:10 am Post subject: |
 |
|
| casper wrote: | | yawalkar wrote: | | casper wrote: | i saw it in hurry as market is opening and i am yet to be ready. 
at a glance. apart from a dt in 60min , nothing seems to me as a cause of the bd. but it was a severe correction. i think due to a high bull charge, it was almost certain to be broken down someday. it happened,
now the good news is we got a very big vol with a green candle yesterday. may be a relief rally is on the card
in case of a rally. 1700 and 1750 will be my target, as 1700 is the lower bb and 1745 is 34ema in eod chart. if it sustain above 1750, then 1850 can be our next target. but in case of a further downfall from here, i mean from present level, i see a support only at 1550 level
as i wrote, tht i am writing in a hurry, i will add if any thing i find later |
Dear Casper,
Thanks for u r reply.
I want to know how you give support at 1550 lvl.? what are the indicators or theory. Also give details for tgt 1700 lower (bb) what is this? i don't understand this. for 1850 what t.a. u have done? can u explain pls. take your time. i don't have any hurry. I just taken this stock for study. |
now it seems that i have atleast one hour in my hand before i start up any thing. so i am replying u with calmness 
1550 is the 100% fib retracement level of previous upmove as per ichart premium( the free fixed flash chart-3f chart!!!!  ) )
to be precise, the level is 1567, not 1550. as the corrective moves almost broken every level and its equally true that due to a heavy bull run, not much support were there. so the only ray of hope is 1550 level of fib to provide any support. so i told u that if the current level is further broken, then we got a support around 1550
the lower bb means the lower bolinger band. bollinger band(bb) is a continuous band which shows immediate strong support and resistance
in my experience i have noticed that lower or upper bb can not be broken very easily without a bd or bo respectively
whenever this lower or upper band is broken, we generally get very strong movements
to know how it works, u just add the bollinger band in the fash chart eod{charts(premium)} as one of the upper indicators and see how it has given support and resistance
in case of drreddy. we have broken lower bb during correction, so in order to go up, this lower bb will provide strong resistance to any upmove until it gets breached by closing. after getting breached, it will be the strongest support available
if u need to learn more about bb and how to use it in positional trading, go to the link below. this strategy is proposed by a senior trader. named trade.master. this one helped me alot to understand how to take positions in a choppy market and yet making good gains
but my only sorrow is. though i have reffred it to almost evryone whoever came to my touch. no body seems to me , gave any importance to it 
the link is http://www.icharts.in/forum/swing-trades-based-on-modified-bb-and-rsi-t1742.html
see if it helps u any way
 |
brother, thanks for your valuable comments and knowledge.
I read and understand the theory of bb and stored in my knowlede box.   & will surly apply when needed. & will surly apply when needed.
Right now yesterday drreddy came inside the bb levles. it means we can expect 1750 in near term.
ok brother going to office. will meet soon.
|
|
| Back to top |
|
 |
vishytns
White Belt

Joined: 26 Nov 2009
Posts: 206
|
Post: #883  Posted: Fri Dec 24, 2010 8:13 am Post subject: Posted: Fri Dec 24, 2010 8:13 am Post subject: |
 |
|
Casper/Sumesh,
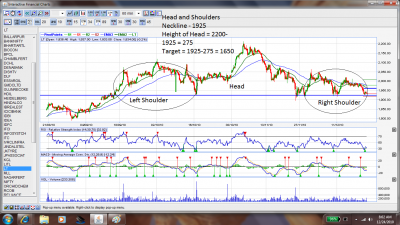
There is an head and shoulders in LT, check the chart and comment. H/s has still not broken down.
Vishy
| Description: |
|
| Filesize: |
259.15 KB |
| Viewed: |
267 Time(s) |
|
|
|
| Back to top |
|
 |
vishytns
White Belt

Joined: 26 Nov 2009
Posts: 206
|
Post: #884  Posted: Fri Dec 24, 2010 8:25 am Post subject: Posted: Fri Dec 24, 2010 8:25 am Post subject: |
 |
|
Casper/Sumesh,
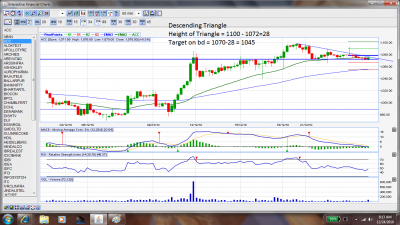
ACC, DT. Check the chart and comment. According to me following is the observation
1. There is a weekly pivot at 1065, if that breaks we should targets of 1045.
2. MACD Histogram cycle is already negative and has spent considerable ammount of time in negative cycle. If there is an hourly close below 1065 it would start one more negative Histogram cycle (MACD bearish).
Enter into the trade only after weekly pivot is broken down on hourly basis
Casper, Any comments on bollinger bands of this stock.
Vishy
| Description: |
|
| Filesize: |
242.78 KB |
| Viewed: |
265 Time(s) |
|
|
|
| Back to top |
|
 |
vishytns
White Belt

Joined: 26 Nov 2009
Posts: 206
|
Post: #885  Posted: Fri Dec 24, 2010 8:35 am Post subject: Posted: Fri Dec 24, 2010 8:35 am Post subject: |
 |
|
Casper/Sumesh,
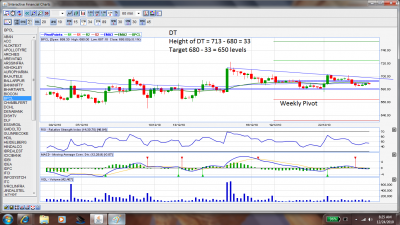
BPCL has DT, please check the chart and comment
My observation
1. on breaking 680, first target would be 663 (Weely R1).
2. If weekly R1 is broken next target would be 650.
3. Stop loss would be hourly close above weekly pivot (LOC) at 692
Vishy
| Description: |
|
| Filesize: |
237.43 KB |
| Viewed: |
260 Time(s) |
|
|
|
| Back to top |
|
 |
|
|
You cannot post new topics in this forum
You cannot reply to topics in this forum
You cannot edit your posts in this forum
You cannot delete your posts in this forum
You cannot vote in polls in this forum
You can attach files in this forum
You can download files in this forum
|
Powered by phpBB © 2001, 2005 phpBB Group
|
|
|

