|
|
| View previous topic :: View next topic |
| Author |
a layman's approach to break out and break down |
casper
Green Belt

Joined: 02 Oct 2010
Posts: 1315
|
Post: #91  Posted: Tue Nov 02, 2010 8:35 am Post subject: Posted: Tue Nov 02, 2010 8:35 am Post subject: |
 |
|
hi girishhu1,
i have gone through all the scrips we discussed earlier.
updates are here:-
aloktext: yesterday it has reached 29 zone. today it may go up towards the target (rounding bottom) or may consolidate here for a break (cup & handle)
glenmark: its ok
hindoilexp: as i mentioned that its consolidating and is just above the bo, we can hold it as long as it respects the upper tl of the pattern as a support
rajeshexport: it could not sustain above 123. today if it sustain 123 then we may get some upmove.
jswsteel: a consolidated move to form the handle. vol decreased significantly, but its a classical case of handle formation, so i dont think that we need to "exit" here
sonatsoftw: its ok
in case of a huge gap up or gap down opening, the market seems to "digest" the move before taking a proper trend.
i can remember the days before September, in those days almost every gap up was followed by bearish sentiments and every gap down was followed by bullish one.
but during the September bull charge, we saw that a huge gap up was followed by strong up move which is the classical characteristic of a bull charge
yesterday we had a huge gap up followed by choppy and then moderately bullish sentiment as practically we had a move for 25-35 pts (6092-6117pts wid a high of 6132) in this kind of gap up followed by choppy to bullish move, we will not have very good vol and as the price will tend to move within a band, we may not get open=low in lots of cases,
so here we have to rely on the eod data and delivery like approach in order to trade the bo scrips
|
|
| Back to top |
|
 |
|
|  |
casper
Green Belt

Joined: 02 Oct 2010
Posts: 1315
|
Post: #92  Posted: Tue Nov 02, 2010 9:10 am Post subject: Posted: Tue Nov 02, 2010 9:10 am Post subject: |
 |
|
yesterday after not getting any scrip to buy for intraday as none of our recommendations has a open=low.(cummins has a open= high in future and i had shorted it) i used the real time data to find out patterns to trade (as i was not comfortable to hold short position in a +market), among my yesterday trades, im posting two examples.
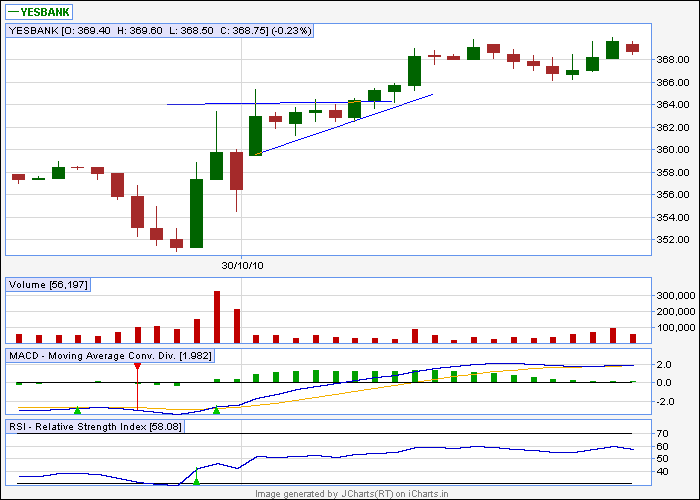
in my 1st trade, it was yes bank, i have seen an ascending triangle was forming and verified it in 10/15/20 min tf
the result was more or less satisfactory.
i entered at 363 and was successful to get 368
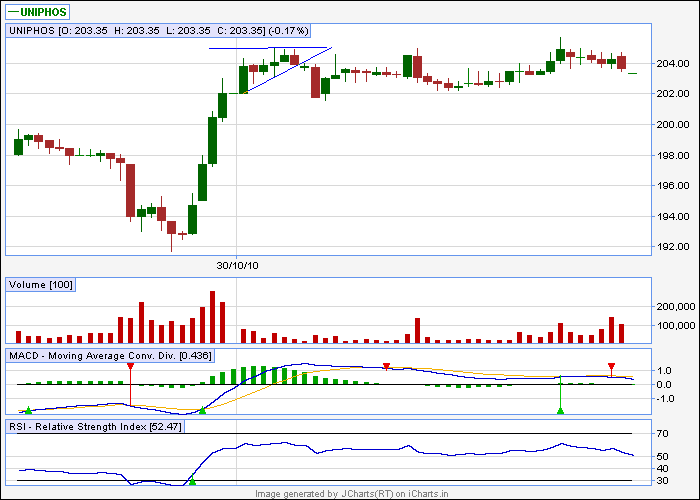
but in my 2nd trade, i saw another ascending triangle is forming in uniphos but i did not bothered(!!!!) to verify it in higher tfs.
i entered here at 203.5 then price started going down toward 202 level, though recovered in later course, and made a high of 205.75. but driven by greed and satisfaction, that i have successfully got an ascending triangle (!!!!), i did not closed my position and waited.just to see its closing at 204 something.
im holding this scrips (which i rarely do) its a good stock and i hope to get out from it today, but thats not the prb
prb is, in case of real time data we may get stuck if we dont confirm a pattern with higher tf charts, its ok to trade wid a lower tf, but then,we have to check our greed.
i hv learned something yesterday and thought to share wid u, so posted all the episode here
| Description: |
|
| Filesize: |
8.28 KB |
| Viewed: |
1842 Time(s) |
|
| Description: |
|
| Filesize: |
7.67 KB |
| Viewed: |
1842 Time(s) |
|
|
|
| Back to top |
|
 |
newinvestor
White Belt

Joined: 16 Feb 2010
Posts: 120
|
Post: #93  Posted: Tue Nov 02, 2010 4:42 pm Post subject: Posted: Tue Nov 02, 2010 4:42 pm Post subject: |
 |
|
Hi Casper. How was your day in the Market today.
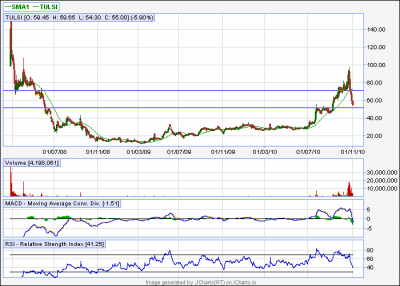
Was just checking Tulsi extrusions. Are we seeing a cup and Handle being formed? Long consolidation, jump to first reaction high of around 90-100,
now maybe targeting the last reaction high of around 55?
can you pls look at the chart and comment? is this a worthwhile buy for a rid to 95 and beyond on a breakout?
|
|
| Back to top |
|
 |
newinvestor
White Belt

Joined: 16 Feb 2010
Posts: 120
|
Post: #94  Posted: Tue Nov 02, 2010 5:47 pm Post subject: Alembic Posted: Tue Nov 02, 2010 5:47 pm Post subject: Alembic |
 |
|
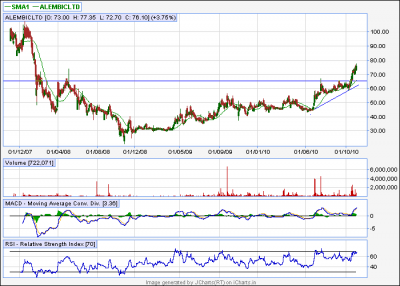
| Alembic b/o above 75 ? Seems to be breaking above the right rim of the cup? Maybe we wait for a handle to form now.
|
|
| Back to top |
|
 |
casper
Green Belt

Joined: 02 Oct 2010
Posts: 1315
|
Post: #95  Posted: Tue Nov 02, 2010 8:15 pm Post subject: Posted: Tue Nov 02, 2010 8:15 pm Post subject: |
 |
|
hi newinvestor,
ya,tulsi is forming a cup & handle, but the prb is the handle part has declined a lil over 1/3 of right arm and also in a downtrend,
so untill it shows a trend reversal, it would be not advisable to enter here,
as it has broken down the 1/3 viz 70 zone, now it has become a resistance in case of an upmove, and it has a support around 50
u can buy if it takes support of 50 and starts heading upwards, and after 70 i think it will show some good move towards 100
and in alembic ltd, a rounding bottom is in progress,
as it has cleared the highest reaction high, we may start accumulate this stock with a mid term target of 100, only after reaching 100, it will face the break out resistance, if it clears and head north then its a rounding bottom, and if starts consolidating at bo level, then it will be a cup &handle.
both the scrip u mentioned have consolidated over a very long time and if they clear their resistance levels and gives a bo, then who knows for their prolonged consolidation, they may become multi-bagger.
(i dont say its a multi- bagger.just talking abt a possibility)
| Description: |
|
| Filesize: |
16.23 KB |
| Viewed: |
449 Time(s) |
|
| Description: |
|
| Filesize: |
13.67 KB |
| Viewed: |
418 Time(s) |
|
|
|
| Back to top |
|
 |
bassan
White Belt

Joined: 01 Dec 2009
Posts: 57
|
Post: #96  Posted: Tue Nov 02, 2010 8:47 pm Post subject: tisco&dlf views Posted: Tue Nov 02, 2010 8:47 pm Post subject: tisco&dlf views |
 |
|
Hello Casper,
expecting your views on tisco&dlf pls
|
|
| Back to top |
|
 |
casper
Green Belt

Joined: 02 Oct 2010
Posts: 1315
|
Post: #97  Posted: Tue Nov 02, 2010 9:26 pm Post subject: Posted: Tue Nov 02, 2010 9:26 pm Post subject: |
 |
|
hi bassan,
dlf is in downtrend, as per adx reading,the down trend is quite mature, so it may start a lil bit consolidation at the following support levels, viz 342,337-335, and if these levels are breached, then no strong support is seen upto 320.
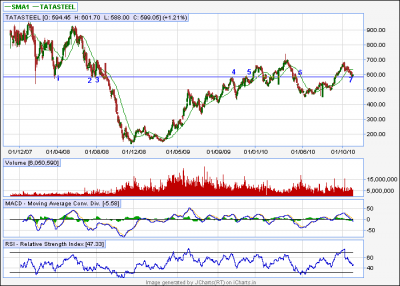
in case of tatasteel,
it has got support from a flat tl which has successfully chocked price movements for at least 7 times in the past. and tisco, at this level, may switch to an uptrend,(today is a positive day), if it goes up then targets will be 650 and 680, above which the handle formation is finished, so we may expect a strong upward move above 680 level.
at the same time, if the current support is breached then there is no considerable support up to 550
| Description: |
|
| Filesize: |
18.14 KB |
| Viewed: |
437 Time(s) |
|
|
|
| Back to top |
|
 |
casper
Green Belt

Joined: 02 Oct 2010
Posts: 1315
|
Post: #98  Posted: Tue Nov 02, 2010 9:57 pm Post subject: Posted: Tue Nov 02, 2010 9:57 pm Post subject: |
 |
|
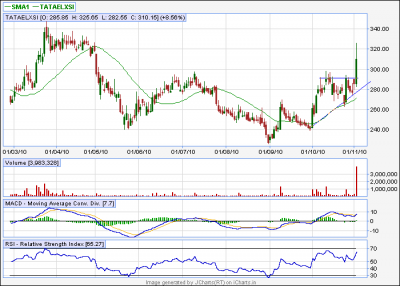
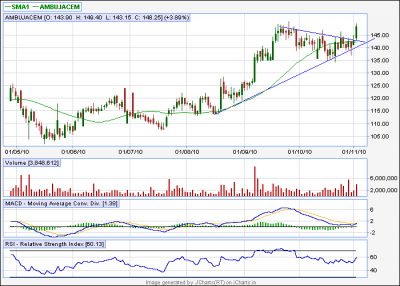
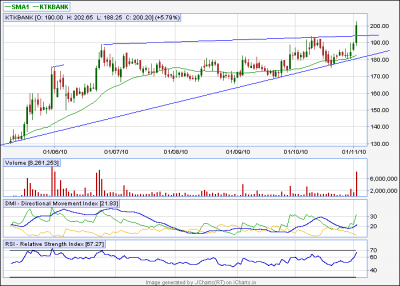
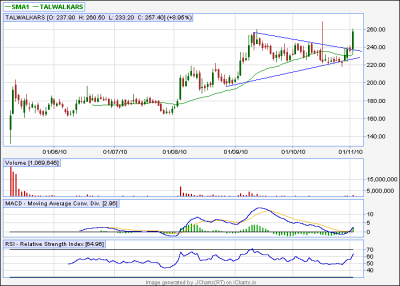
posting my findings for next trading sessions,
talwalkars: target 275,285,290
tataelxsi : target 335,340
ktkbank : target 220,250
ambujacem : target 150,155
| Description: |
|
| Filesize: |
14.32 KB |
| Viewed: |
463 Time(s) |
|
| Description: |
|
| Filesize: |
13.79 KB |
| Viewed: |
434 Time(s) |
|
| Description: |
|
| Filesize: |
14.28 KB |
| Viewed: |
423 Time(s) |
|
| Description: |
|
| Filesize: |
12.17 KB |
| Viewed: |
562 Time(s) |
|
|
|
| Back to top |
|
 |
bassan
White Belt

Joined: 01 Dec 2009
Posts: 57
|
Post: #99  Posted: Wed Nov 03, 2010 12:23 am Post subject: Posted: Wed Nov 03, 2010 12:23 am Post subject: |
 |
|
Thankyou very much Casper. 
|
|
| Back to top |
|
 |
ragarwal
Yellow Belt

Joined: 16 Nov 2008
Posts: 582
|
Post: #100  Posted: Wed Nov 03, 2010 12:57 am Post subject: Posted: Wed Nov 03, 2010 12:57 am Post subject: |
 |
|
dear casper can u plz post me the analsis of gspl,mcleodrussel,kamat hotel and cosmo films .
warm regds rashmi
|
|
| Back to top |
|
 |
aromal
White Belt

Joined: 22 Mar 2010
Posts: 302
|
Post: #101  Posted: Wed Nov 03, 2010 7:20 am Post subject: Posted: Wed Nov 03, 2010 7:20 am Post subject: |
 |
|
[quote="casper"]posting my findings for next trading sessions,
talwalkars: target 275,285,290
tataelxsi : target 335,340
ktkbank : target 220,250
ambujacem : target 150,155[tata elexi wat a move great...... forum rocking as always
]
|
|
| Back to top |
|
 |
aromal
White Belt

Joined: 22 Mar 2010
Posts: 302
|
Post: #102  Posted: Wed Nov 03, 2010 7:24 am Post subject: rbn Posted: Wed Nov 03, 2010 7:24 am Post subject: rbn |
 |
|
| casper wrote: | yesterday after not getting any scrip to buy for intraday as none of our recommendations has a open=low.(cummins has a open= high in future and i had shorted it) i used the real time data to find out patterns to trade (as i was not comfortable to hold short position in a +market), among my yesterday trades, im posting two examples.
in my 1st trade, it was yes bank, i have seen an ascending triangle was forming and verified it in 10/15/20 min tf
the result was more or less satisfactory.
i entered at 363 and was successful to get 368
but in my 2nd trade, i saw another ascending triangle is forming in uniphos but i did not bothered(!!!!) to verify it in higher tfs.
i entered here at 203.5 then price started going down toward 202 level, though recovered in later course, and made a high of 205.75. but driven by greed and satisfaction, that i have successfully got an ascending triangle (!!!!), i did not closed my position and waited.just to see its closing at 204 something.
im holding this scrips (which i rarely do) its a good stock and i hope to get out from it today, but thats not the prb
prb is, in case of real time data we may get stuck if we dont confirm a pattern with higher tf charts, its ok to trade wid a lower tf, but then,we have to check our greed.
i hv learned something yesterday and thought to share wid u, so posted all the episode here |
| Description: |
|
| Filesize: |
14.28 KB |
| Viewed: |
397 Time(s) |
|
|
|
| Back to top |
|
 |
aromal
White Belt

Joined: 22 Mar 2010
Posts: 302
|
Post: #103  Posted: Wed Nov 03, 2010 7:27 am Post subject: Re: rbn Posted: Wed Nov 03, 2010 7:27 am Post subject: Re: rbn |
 |
|
| aromal wrote: | | casper wrote: | yesterday after not getting any scrip to buy for intraday as none of our recommendations has a open=low.(cummins has a open= high in future and i had shorted it) i used the real time data to find out patterns to trade (as i was not comfortable to hold short position in a +market), among my yesterday trades, im posting two examples.
in my 1st trade, it was yes bank, i have seen an ascending triangle was forming and verified it in 10/15/20 min tf
the result was more or less satisfactory.
i entered at 363 and was successful to get 368
but in my 2nd trade, i saw another ascending triangle is forming in uniphos but i did not bothered(!!!!) to verify it in higher tfs.
i entered here at 203.5 then price started going down toward 202 level, though recovered in later course, and made a high of 205.75. but driven by greed and satisfaction, that i have successfully got an ascending triangle (!!!!), i did not closed my position and waited.just to see its closing at 204 something.
im holding this scrips (which i rarely do) its a good stock and i hope to get out from it today, but thats not the prb
prb is, in case of real time data we may get stuck if we dont confirm a pattern with higher tf charts, its ok to trade wid a lower tf, but then,we have to check our greed.
i hv learned something yesterday and thought to share wid u, so posted all the episode here |
|
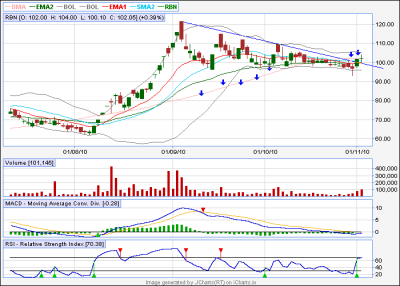
| Quote: | | please confirm RBN break out????? |
|
|
| Back to top |
|
 |
aromal
White Belt

Joined: 22 Mar 2010
Posts: 302
|
Post: #104  Posted: Wed Nov 03, 2010 7:28 am Post subject: Re: rbn Posted: Wed Nov 03, 2010 7:28 am Post subject: Re: rbn |
 |
|
| aromal wrote: | | casper wrote: | yesterday after not getting any scrip to buy for intraday as none of our recommendations has a open=low.(cummins has a open= high in future and i had shorted it) i used the real time data to find out patterns to trade (as i was not comfortable to hold short position in a +market), among my yesterday trades, im posting two examples.
in my 1st trade, it was yes bank, i have seen an ascending triangle was forming and verified it in 10/15/20 min tf
the result was more or less satisfactory.
i entered at 363 and was successful to get 368
but in my 2nd trade, i saw another ascending triangle is forming in uniphos but i did not bothered(!!!!) to verify it in higher tfs.
i entered here at 203.5 then price started going down toward 202 level, though recovered in later course, and made a high of 205.75. but driven by greed and satisfaction, that i have successfully got an ascending triangle (!!!!), i did not closed my position and waited.just to see its closing at 204 something.
im holding this scrips (which i rarely do) its a good stock and i hope to get out from it today, but thats not the prb
prb is, in case of real time data we may get stuck if we dont confirm a pattern with higher tf charts, its ok to trade wid a lower tf, but then,we have to check our greed.
i hv learned something yesterday and thought to share wid u, so posted all the episode here |
|
| Quote: | | rbn break out?????? |
|
|
| Back to top |
|
 |
aromal
White Belt

Joined: 22 Mar 2010
Posts: 302
|
Post: #105  Posted: Wed Nov 03, 2010 7:29 am Post subject: Posted: Wed Nov 03, 2010 7:29 am Post subject: |
 |
|
[quote="aromal"] | casper wrote: | posting my findings for next trading sessions,
talwalkars: target 275,285,290
tataelxsi : target 335,340
ktkbank : target 220,250
ambujacem : target 150,155[tata elexi wat a move great...... forum rocking as always
] |
| Quote: | | dma important in break out charts???? |
|
|
| Back to top |
|
 |
|
|
You cannot post new topics in this forum
You cannot reply to topics in this forum
You cannot edit your posts in this forum
You cannot delete your posts in this forum
You cannot vote in polls in this forum
You can attach files in this forum
You can download files in this forum
|
Powered by phpBB © 2001, 2005 phpBB Group
|
|
|

