|
|
| View previous topic :: View next topic |
| Author |
a layman's approach to break out and break down |
sumesh_sol
Brown Belt

Joined: 06 Jun 2010
Posts: 2344
|
Post: #901  Posted: Sun Dec 26, 2010 9:06 pm Post subject: For Intraday on Monday..(27/12/2010) Posted: Sun Dec 26, 2010 9:06 pm Post subject: For Intraday on Monday..(27/12/2010) |
 |
|
Hi Friends,
Following setups can be tried on Monday.
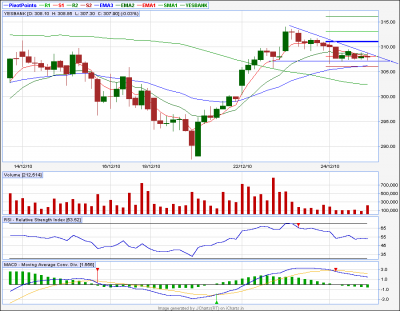
1.) Yes Bank : Short below 306 for 303 & 301
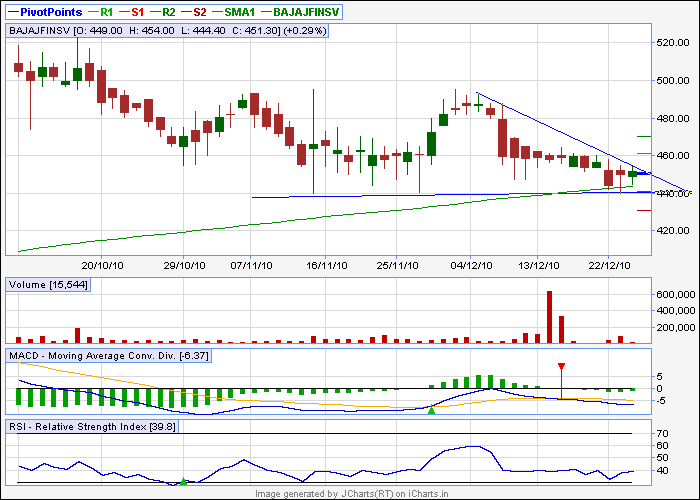
2.)BAJAJFINSV(eod chart): Short below 439(only after 60hr candle close) for 430 & 415. A short at 458 can also be taken with SL above 460 cc (this time target 440).
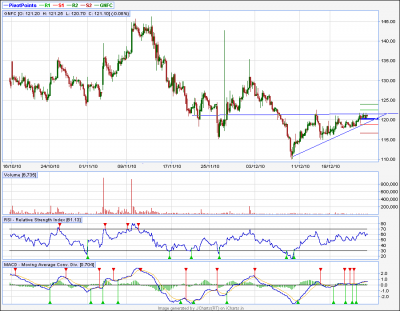
3.)GNFC : Buy above 123 for tgt of 126/128
Regards,
Sumesh
| Description: |
|
| Filesize: |
11.48 KB |
| Viewed: |
1052 Time(s) |
|
| Description: |
|
| Filesize: |
23.7 KB |
| Viewed: |
254 Time(s) |
|
| Description: |
|
| Filesize: |
18.25 KB |
| Viewed: |
274 Time(s) |
|
|
|
| Back to top |
|
 |
|
|  |
casper
Green Belt

Joined: 02 Oct 2010
Posts: 1315
|
Post: #902  Posted: Mon Dec 27, 2010 8:51 am Post subject: Posted: Mon Dec 27, 2010 8:51 am Post subject: |
 |
|
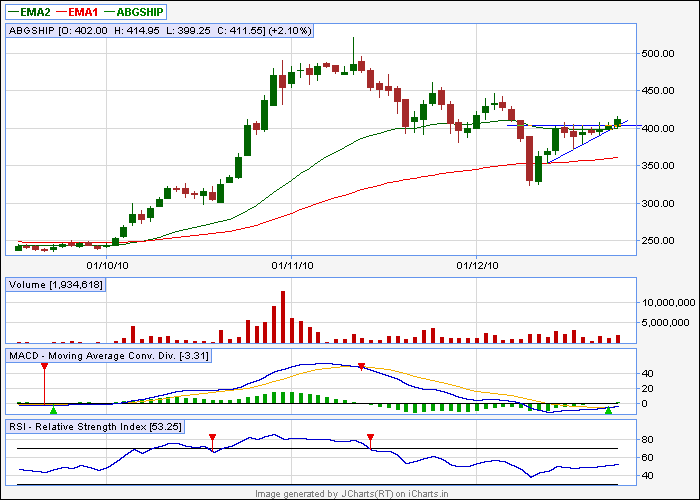
abg ship
buy above 410, target 425, 435
| Description: |
|
| Filesize: |
10.32 KB |
| Viewed: |
986 Time(s) |
|
|
|
| Back to top |
|
 |
casper
Green Belt

Joined: 02 Oct 2010
Posts: 1315
|
Post: #903  Posted: Mon Dec 27, 2010 10:31 am Post subject: Posted: Mon Dec 27, 2010 10:31 am Post subject: |
 |
|
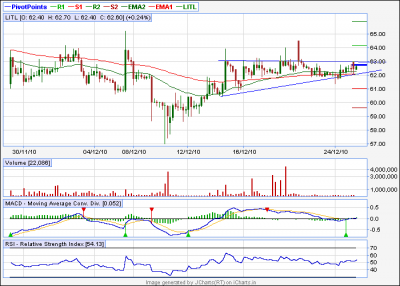
LITL
buy above 63. its the opening= high
if it stays above 63 then only buy. target 64.40
| Description: |
|
| Filesize: |
13.51 KB |
| Viewed: |
244 Time(s) |
|
|
|
| Back to top |
|
 |
vrushabh123
White Belt

Joined: 18 Nov 2010
Posts: 39
|
Post: #904  Posted: Mon Dec 27, 2010 10:32 am Post subject: hhiiiii Posted: Mon Dec 27, 2010 10:32 am Post subject: hhiiiii |
 |
|
hey bro i was just abt to ask u abt abg ship sort of pennant bo..tgt comes 460.. and u already cleared it..THANKS yaar how come u know i was abt to ask u abt it .... ha ?

|
|
| Back to top |
|
 |
casper
Green Belt

Joined: 02 Oct 2010
Posts: 1315
|
Post: #905  Posted: Mon Dec 27, 2010 2:35 pm Post subject: Re: hhiiiii Posted: Mon Dec 27, 2010 2:35 pm Post subject: Re: hhiiiii |
 |
|
| vrushabh123 wrote: | hey bro i was just abt to ask u abt abg ship sort of pennant bo..tgt comes 460.. and u already cleared it..THANKS yaar how come u know i was abt to ask u abt it .... ha ?
 |
hi rusahbh, i knew, bcoz all we are brothers  
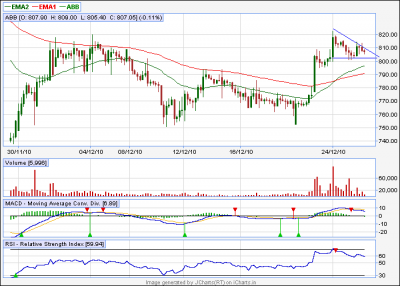
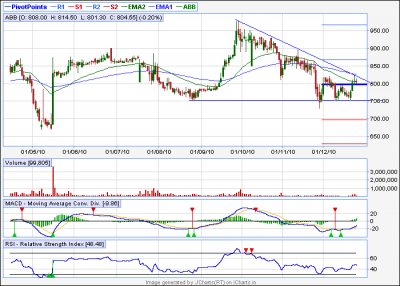
check abb, sitting just on the monthly pivot, (not shown in picture, piv is 801)
will not be broken easily, but once broken we can expect not only 780 (as per 60 min tf) but may be more, as it is already at the bb upper in eod. so chance of going down is higher
ps:- the abgship is still valid,its still consolidating, could not hold above 410. now macd is in sell mode, but i think if it goes up to 410 again to break out, macd will be bulish again as histogram is not much strong
| Description: |
|
| Filesize: |
13.35 KB |
| Viewed: |
249 Time(s) |
|
|
|
| Back to top |
|
 |
vrushabh123
White Belt

Joined: 18 Nov 2010
Posts: 39
|
Post: #906  Posted: Mon Dec 27, 2010 3:49 pm Post subject: hiii Posted: Mon Dec 27, 2010 3:49 pm Post subject: hiii |
 |
|
| hii dear i also went through abb but dont u think its more of a s. t in EOD...bo is given at 779...also with vol..n in 60 min its d.t . so which is more relevant according to u...
|
|
| Back to top |
|
 |
vishytns
White Belt

Joined: 26 Nov 2009
Posts: 206
|
Post: #907  Posted: Mon Dec 27, 2010 4:35 pm Post subject: Posted: Mon Dec 27, 2010 4:35 pm Post subject: |
 |
|
hi Casper/Vrushabh,
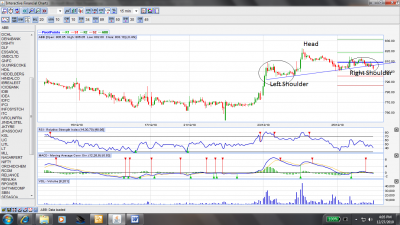
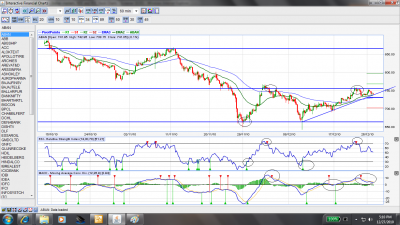
Here are my thoughts and ABB.
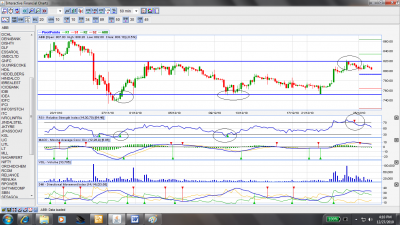
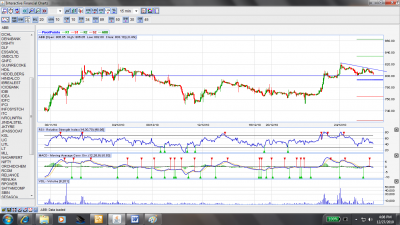
Chart ABB1, Head and shoulders, upward inclined (not very reliable). Price already below neckline.
Chart ABB2, DT, price still above the support line.
Chart ABB3, Rectangular pattern, see the circle points based on which i have drawn the channel.
Short trade
==========
For any of the trades one should short below, weekly pivot of 793.
Stop loss would be 820. One can expect target of 763 (Weekly S1) and the bottom end of the channel.
Long Trade
=========
Hourly close above 820 with good volumes above AVG volume, and initial target of 834 (Weekly R1). In this trade stop loss would be 815.
Sumesh, please provide your comments as well.
Vishy
| Description: |
|
| Filesize: |
175.47 KB |
| Viewed: |
235 Time(s) |
|
| Description: |
|
| Filesize: |
180.73 KB |
| Viewed: |
265 Time(s) |
|
| Description: |
|
| Filesize: |
159.79 KB |
| Viewed: |
247 Time(s) |
|
|
|
| Back to top |
|
 |
vishytns
White Belt

Joined: 26 Nov 2009
Posts: 206
|
Post: #908  Posted: Mon Dec 27, 2010 5:17 pm Post subject: Posted: Mon Dec 27, 2010 5:17 pm Post subject: |
 |
|
Friends,
One more stock for your comments. ABAN
1. Chart specifies the channel in which price is oscillating. At present it is now at the upper end of the channel.
2. Price also has a sloped support line as depicted in the chart.
Long Trade
==========
Buy above hourly close above Weekly S1(768) with target of Weekly S2 (797),
Stop loss would be hourly close just below 756.
Short Trade
=========
Hourly close below the sloping trendline, or one can also consider weekly Pivot (731) with target of 702 and bottom end of the channel .
Vishy
| Description: |
|
| Filesize: |
186.92 KB |
| Viewed: |
258 Time(s) |
|
|
|
| Back to top |
|
 |
casper
Green Belt

Joined: 02 Oct 2010
Posts: 1315
|
Post: #909  Posted: Mon Dec 27, 2010 8:11 pm Post subject: Posted: Mon Dec 27, 2010 8:11 pm Post subject: |
 |
|
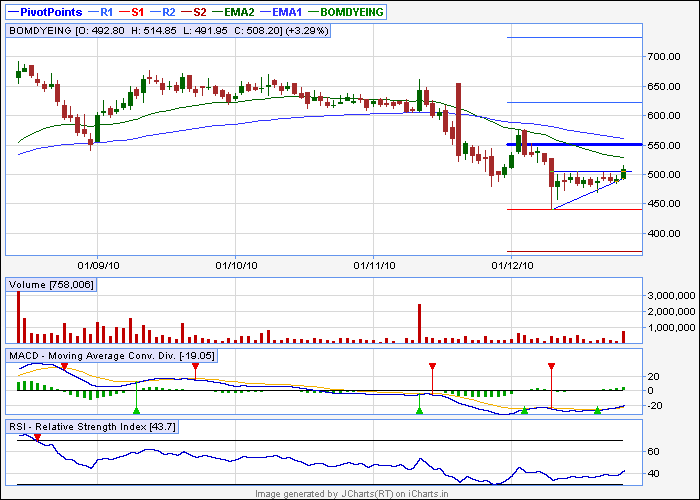
bomdyeing-eod
i think it should reach 530(34 ema) at least
| Description: |
|
| Filesize: |
11.47 KB |
| Viewed: |
956 Time(s) |
|
|
|
| Back to top |
|
 |
casper
Green Belt

Joined: 02 Oct 2010
Posts: 1315
|
Post: #910  Posted: Mon Dec 27, 2010 8:24 pm Post subject: Re: hiii Posted: Mon Dec 27, 2010 8:24 pm Post subject: Re: hiii |
 |
|
| vrushabh123 wrote: | | hii dear i also went through abb but dont u think its more of a s. t in EOD...bo is given at 779...also with vol..n in 60 min its d.t . so which is more relevant according to u... |
hi rusabh
look at the chart im posting now 
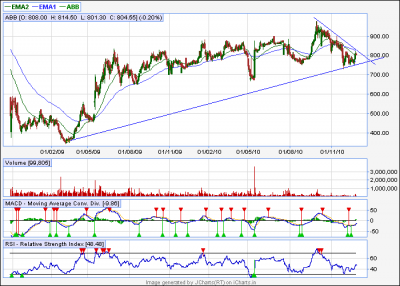
its now looking like a big dt in eod too
whenever u try to find the pattern, just try to follow 3 points to draw a tl. at times we can draw tl with 2 points bot that wont be stronger than a 3 point tl
i can draw it like an st, but in that case, the pattern will lose its compactness, while without a break down, i can not swear that it will be dt and with out a break out u also can not swear that it will be st, but the more compact pattern is more likely to be successful
i am posting both the dt and st version of the abb eod chart, (this is the st version which i could see, u check if it is the pattern u referred or not?) u see and reply me which one is more confident-looking? 
| Description: |
|
| Filesize: |
18.74 KB |
| Viewed: |
240 Time(s) |
|
| Description: |
|
| Filesize: |
14.88 KB |
| Viewed: |
243 Time(s) |
|
|
|
| Back to top |
|
 |
singh.ravee
Yellow Belt

Joined: 12 Aug 2010
Posts: 678
|
Post: #911  Posted: Mon Dec 27, 2010 8:29 pm Post subject: Posted: Mon Dec 27, 2010 8:29 pm Post subject: |
 |
|
Casper Hello,
Hope you are doing gr8.
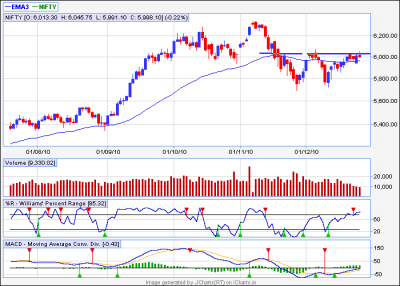
I am attaching eod chart of nifty spot for your consideration. Earlier I shared with you double bottom formation in nifty spot with neckline around 6015. I would like to learn whether this pattern has failed(as nifty spot failed to move beyond 6015) or we need to wait for another day or so.
Also, as I have shared earlier that my entry points in intraday trade have improved significantly after reading ST Sir's thread. I would like to learn from you is there any method by which one can judge about the weakning of current trend. Based upon this judgement one can plan timely exit from the stock.
Thanks and Regards
Ravee
| Description: |
|
| Filesize: |
13.01 KB |
| Viewed: |
252 Time(s) |
|
|
|
| Back to top |
|
 |
singh.ravee
Yellow Belt

Joined: 12 Aug 2010
Posts: 678
|
Post: #912  Posted: Mon Dec 27, 2010 8:37 pm Post subject: Posted: Mon Dec 27, 2010 8:37 pm Post subject: |
 |
|
Casper,
One thing i forgot to add was falling volumes on nift spot.
rgds
ravee
|
|
| Back to top |
|
 |
casper
Green Belt

Joined: 02 Oct 2010
Posts: 1315
|
Post: #913  Posted: Mon Dec 27, 2010 8:40 pm Post subject: Posted: Mon Dec 27, 2010 8:40 pm Post subject: |
 |
|
| vishytns wrote: | hi Casper/Vrushabh,
Here are my thoughts and ABB.
Chart ABB1, Head and shoulders, upward inclined (not very reliable). Price already below neckline.
Chart ABB2, DT, price still above the support line.
Chart ABB3, Rectangular pattern, see the circle points based on which i have drawn the channel.
Short trade
==========
For any of the trades one should short below, weekly pivot of 793.
Stop loss would be 820. One can expect target of 763 (Weekly S1) and the bottom end of the channel.
Long Trade
=========
Hourly close above 820 with good volumes above AVG volume, and initial target of 834 (Weekly R1). In this trade stop loss would be 815.
Sumesh, please provide your comments as well.
Vishy |
anna all is well 
bus mein hamesha ek chiz sochta hun
whatever u post, there is always a head and shoulder
  
u gave such a nice explanation, but still u mentioned h/s
i just rem how, in our personal conversation, u always interpret any chart as h/s at 1st, now while im typing, all these are coming my mind and i am smiling all the way
how u say"look its h/s" and how i reply" if its h/s, then the head must belong to the ravana, it has got multiple heads"  and then,ultimately the h/s proves itself by confirming with a bd and then,ultimately the h/s proves itself by confirming with a bd
how u always encourage me to post in forum and supply most of the materials i post. 
all are coming in my mind at this moment. these days i am having a 3rd class schedule, so im really missing u.
sorry for being personal in the public forum, plz dont mind!!!
|
|
| Back to top |
|
 |
casper
Green Belt

Joined: 02 Oct 2010
Posts: 1315
|
Post: #914  Posted: Mon Dec 27, 2010 9:16 pm Post subject: Posted: Mon Dec 27, 2010 9:16 pm Post subject: |
 |
|
| singh.ravee wrote: | Casper Hello,
Hope you are doing gr8.
I am attaching eod chart of nifty spot for your consideration. Earlier I shared with you double bottom formation in nifty spot with neckline around 6015. I would like to learn whether this pattern has failed(as nifty spot failed to move beyond 6015) or we need to wait for another day or so.
Also, as I have shared earlier that my entry points in intraday trade have improved significantly after reading ST Sir's thread. I would like to learn from you is there any method by which one can judge about the weakning of current trend. Based upon this judgement one can plan timely exit from the stock.
Thanks and Regards
Ravee |
hi ravee
we have successfully closed above monthly pivot and 34 ema so i think we have considerable support at this level, so this double bottom setup is still valid for me
today we could cross the resistance but the china rate hike has ruined our day
i dont give much importance to the reducing volume here, i think as we are approaching to the break out level, fear and indecision is prevailing in the market. for me the real concern will be if we get a break out and volume is still down in that case it will be clear that we lack buyers at the higher levels and big boys are booking profit in rally to get rid of their holdings
though we can see a sell off here and nifty may go down to form a channel/rectangular pattern, but as we are above monthly pivot +34 ema , we have strong supports also, and i think we can sell only if both the supports are broken, until then, i believe chance of going up is very much viable
to understand the longevity of the current trend, u can use dmi/adx
( u may rem, both are same, in ichart, we got dmi instead of adx)
a higher dmi rating means highly trending condition
we will see that in any time frame, any stock can hardly tolerate above 40 dmi. when u see dmi is 40-45, u better get ready, station is coming
but train is still going in full speed, if dmi is crossing above 50.(seldom does) get ready to pull the chain alarm
if and only if(very rarely) dmi is nearing 60, we got a break-fail
now its also possible that now the engine is run out of fuel and stopped safely without a disaster, but wont it be a miracle?
  
|
|
| Back to top |
|
 |
vishytns
White Belt

Joined: 26 Nov 2009
Posts: 206
|
Post: #915  Posted: Mon Dec 27, 2010 9:37 pm Post subject: Posted: Mon Dec 27, 2010 9:37 pm Post subject: |
 |
|
Casper,
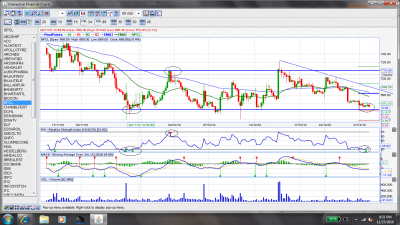
One more stock for your comments. BPCL (60tf)
I see a rectangular pattern in this stock. It is currently at the lower end of the channel. It should take support at these levels and go up. Following is my view on this
1. Buy 660, with first target of 678 (34 ema), stop loss should be hourly close below the weekly S1 (661)
In case if the channel is broken
2. Sell below hourly close below weekly s1 (661) with target of 648.
Note: this stock has very support in range of 640 to 650. If there is any close below 640 levels then stock could see 600 levels.
Vishy
| Description: |
|
| Filesize: |
212.12 KB |
| Viewed: |
241 Time(s) |
|
|
|
| Back to top |
|
 |
|
|
You cannot post new topics in this forum
You cannot reply to topics in this forum
You cannot edit your posts in this forum
You cannot delete your posts in this forum
You cannot vote in polls in this forum
You can attach files in this forum
You can download files in this forum
|
Powered by phpBB © 2001, 2005 phpBB Group
|
|
|

