|
|
| View previous topic :: View next topic |
| Author |
a layman's approach to break out and break down |
mrvishal_g
White Belt

Joined: 17 Sep 2010
Posts: 89
|
Post: #916  Posted: Mon Dec 27, 2010 10:07 pm Post subject: Posted: Mon Dec 27, 2010 10:07 pm Post subject: |
 |
|
Hi Casper,
Please comment on
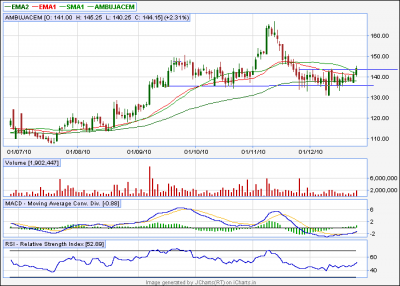
Ambuja cement 144.15………today it close above it current range with more than average vol and also cross 34 & 89 EMA . MACD and RSI both positive target can be 151-160.
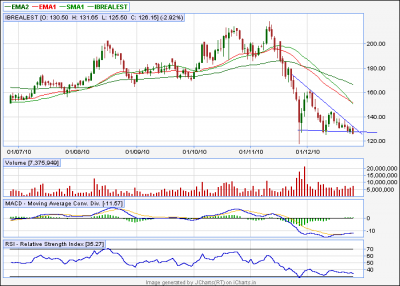
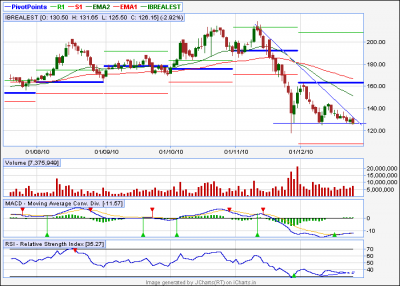
IBRealestate.126.15…………please chk once again, a DT is forming on EOD bd is < 125.5
Chennai petro 249……inverted H&S. MACD and RSI both are positive, it cross 34 & 89 ema on Friday but vol is not supporting
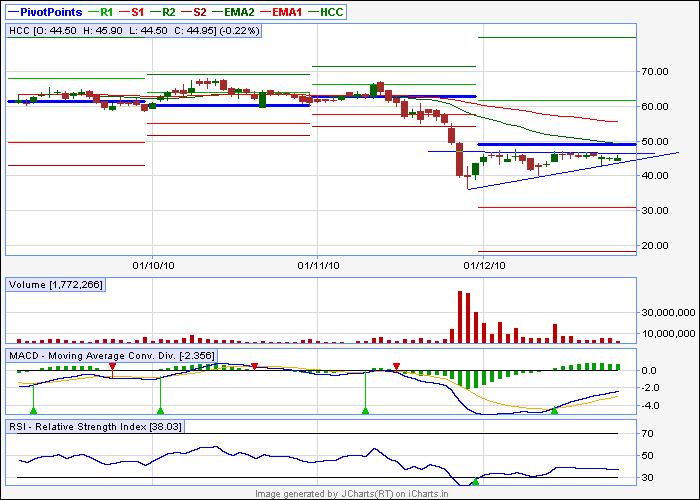
HCC 44.95……….AT is forming MACD bullish while RSI is neutal
Vishal
| Description: |
|
| Filesize: |
24.39 KB |
| Viewed: |
215 Time(s) |
|
| Description: |
|
| Filesize: |
25.18 KB |
| Viewed: |
243 Time(s) |
|
|
|
| Back to top |
|
 |
|
|  |
casper
Green Belt

Joined: 02 Oct 2010
Posts: 1315
|
Post: #917  Posted: Mon Dec 27, 2010 10:42 pm Post subject: Posted: Mon Dec 27, 2010 10:42 pm Post subject: |
 |
|
| vishytns wrote: | Casper,
One more stock for your comments. BPCL (60tf)
I see a rectangular pattern in this stock. It is currently at the lower end of the channel. It should take support at these levels and go up. Following is my view on this
1. Buy 660, with first target of 678 (34 ema), stop loss should be hourly close below the weekly S1 (661)
In case if the channel is broken
2. Sell below hourly close below weekly s1 (661) with target of 648.
Note: this stock has very support in range of 640 to 650. If there is any close below 640 levels then stock could see 600 levels.
Vishy |
perfectly alright
just adding one point, as per rt chart, we got 620 as monthly s1, so below 640. we will have to see it at 620 as well
|
|
| Back to top |
|
 |
vrushabh123
White Belt

Joined: 18 Nov 2010
Posts: 39
|
Post: #918  Posted: Mon Dec 27, 2010 10:56 pm Post subject: hii Posted: Mon Dec 27, 2010 10:56 pm Post subject: hii |
 |
|
hii casper i looked at chart u posted but i m talking abt such big s.t in EOD s.t which i had drawn is from 6/12/10 the upper slope and lower slope line is from 29/11/10..Now u see whether it is s.t or not.. but i tell this is really very confusing... 
|
|
| Back to top |
|
 |
casper
Green Belt

Joined: 02 Oct 2010
Posts: 1315
|
Post: #919  Posted: Mon Dec 27, 2010 10:57 pm Post subject: Posted: Mon Dec 27, 2010 10:57 pm Post subject: |
 |
|
| mrvishal_g wrote: | Hi Casper,
Please comment on
Ambuja cement 144.15………today it close above it current range with more than average vol and also cross 34 & 89 EMA . MACD and RSI both positive target can be 151-160.
IBRealestate.126.15…………please chk once again, a DT is forming on EOD bd is < 125.5
Chennai petro 249……inverted H&S. MACD and RSI both are positive, it cross 34 & 89 ema on Friday but vol is not supporting
HCC 44.95……….AT is forming MACD bullish while RSI is neutal
Vishal |
for ambuja cem, watch out 147 also, its the monthly pivot, so it will offer some resistance also
ibrealest, still shows rsi divergence, (i hv marked in chart)but if it really breaks below 126, then it wont matter, until the bd comes, due to divergence, it might go up like an nvk
so sell below the down tl. but remember the lower bb at 118. so be careful and buy if the slopping tl is broken,in that case, i think it will go up
chennpetro has monthly r1 at 250, buy only if this level is broken, current volume, though not very strong still increasing a lil bit, i think its good sign
hcc has monthly pivot and34 ema around 50 level, right now the rsi is following the price only, as the price is consolidating, so the rsi is neutral
u can but it above 46 but i dont think that it can cross the said resistance, u better avoid it
| Description: |
|
| Filesize: |
10.05 KB |
| Viewed: |
1028 Time(s) |
|
| Description: |
|
| Filesize: |
13.47 KB |
| Viewed: |
231 Time(s) |
|
|
|
| Back to top |
|
 |
casper
Green Belt

Joined: 02 Oct 2010
Posts: 1315
|
Post: #920  Posted: Mon Dec 27, 2010 11:00 pm Post subject: Re: hii Posted: Mon Dec 27, 2010 11:00 pm Post subject: Re: hii |
 |
|
| vrushabh123 wrote: | hii casper i looked at chart u posted but i m talking abt such big s.t in EOD s.t which i had drawn is from 6/12/10 the upper slope and lower slope line is from 29/11/10..Now u see whether it is s.t or not.. but i tell this is really very confusing...  |
ok i am checking, but u post the chart naa 
on the jchart page( not within the chart but in the chart page) see a button is there, "export as png" click it and the chart will be saved in ur computer
then just add the chart as an attachment with ur msg, its simple

|
|
| Back to top |
|
 |
casper
Green Belt

Joined: 02 Oct 2010
Posts: 1315
|
|
| Back to top |
|
 |
singh.ravee
Yellow Belt

Joined: 12 Aug 2010
Posts: 678
|
Post: #922  Posted: Tue Dec 28, 2010 2:13 am Post subject: Posted: Tue Dec 28, 2010 2:13 am Post subject: |
 |
|
casper bhai,
thank you so much for your views on nifty. wish u and all users a happie trading day.
rgds
ravee
|
|
| Back to top |
|
 |
vishytns
White Belt

Joined: 26 Nov 2009
Posts: 206
|
|
| Back to top |
|
 |
vishytns
White Belt

Joined: 26 Nov 2009
Posts: 206
|
Post: #924  Posted: Tue Dec 28, 2010 8:43 am Post subject: Posted: Tue Dec 28, 2010 8:43 am Post subject: |
 |
|
Casper,
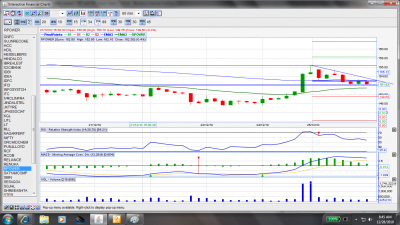
RPOWER, Please comment.
regards
Vishy
| Description: |
|
| Filesize: |
197.55 KB |
| Viewed: |
235 Time(s) |
|
|
|
| Back to top |
|
 |
vishytns
White Belt

Joined: 26 Nov 2009
Posts: 206
|
Post: #925  Posted: Tue Dec 28, 2010 8:46 am Post subject: Posted: Tue Dec 28, 2010 8:46 am Post subject: |
 |
|
Casper,
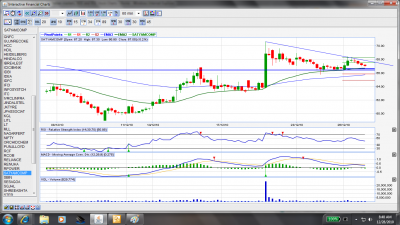
One more stock, SATYAMCOMP.
regards
Vishy
| Description: |
|
| Filesize: |
201.31 KB |
| Viewed: |
241 Time(s) |
|
|
|
| Back to top |
|
 |
vishytns
White Belt

Joined: 26 Nov 2009
Posts: 206
|
Post: #926  Posted: Tue Dec 28, 2010 8:54 am Post subject: Posted: Tue Dec 28, 2010 8:54 am Post subject: |
 |
|
Casper,
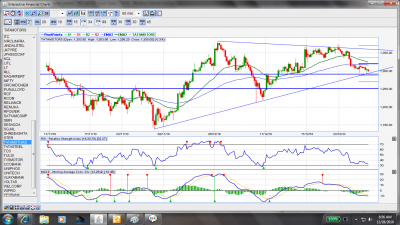
One more stock Tata Motors. PLease provide your comments.
Vishy
| Description: |
|
| Filesize: |
221.28 KB |
| Viewed: |
269 Time(s) |
|
|
|
| Back to top |
|
 |
casper
Green Belt

Joined: 02 Oct 2010
Posts: 1315
|
Post: #927  Posted: Tue Dec 28, 2010 9:08 am Post subject: Posted: Tue Dec 28, 2010 9:08 am Post subject: |
 |
|
ITC has strong support at 168 levels and strong resistance around 171. not so good in my view
styam has very strong support at lower levels. both the ema and weekly pivot is there, so i dont think it will go down easily
rpower has broken down. but 34 ema is at 151. below that weekly pivot is at 150
and what u posted in tata motors, is the same which ravee posted in eod tatamotors a few days earlier
it has strong support of the slopping tl and 34 ema at this level, if broken,we can sell it.if this gives us support we can buy with a target of 1350 and then with a break out,we can add more
|
|
| Back to top |
|
 |
singh.ravee
Yellow Belt

Joined: 12 Aug 2010
Posts: 678
|
Post: #928  Posted: Tue Dec 28, 2010 9:41 am Post subject: Posted: Tue Dec 28, 2010 9:41 am Post subject: |
 |
|
casper hello,
It would be nice on your part, if u can post few charts, as and when possible, to explain the use of dmi on intraday charts.
thanks and regards
ravee
|
|
| Back to top |
|
 |
sumesh_sol
Brown Belt

Joined: 06 Jun 2010
Posts: 2344
|
Post: #929  Posted: Tue Dec 28, 2010 11:13 am Post subject: DEWANHOUS... 60tf.. Posted: Tue Dec 28, 2010 11:13 am Post subject: DEWANHOUS... 60tf.. |
 |
|
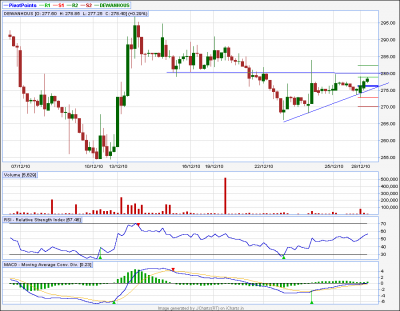
DEWANHOUS... 60tf..
**********************
A break above 280 can take it to 285/288/290 levels...
-Sumesh
| Description: |
|
| Filesize: |
17.76 KB |
| Viewed: |
202 Time(s) |
|
|
|
| Back to top |
|
 |
sumesh_sol
Brown Belt

Joined: 06 Jun 2010
Posts: 2344
|
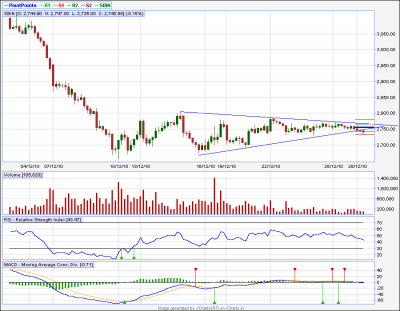
Post: #930  Posted: Tue Dec 28, 2010 11:58 am Post subject: SBIN Posted: Tue Dec 28, 2010 11:58 am Post subject: SBIN |
 |
|
SBIN
**********
Looks like it has broken ST.. Now I'm waiting for today's s1 (2729) to be taken out.. Then short & cover at s3/s4 (2695/2661)..
Reagrds,
Sumesh
| Description: |
|
| Filesize: |
17.79 KB |
| Viewed: |
240 Time(s) |
|
|
|
| Back to top |
|
 |
|
|
You cannot post new topics in this forum
You cannot reply to topics in this forum
You cannot edit your posts in this forum
You cannot delete your posts in this forum
You cannot vote in polls in this forum
You can attach files in this forum
You can download files in this forum
|
Powered by phpBB © 2001, 2005 phpBB Group
|
|
|

