|
|
| View previous topic :: View next topic |
| Author |
a layman's approach to break out and break down |
kamal.icharts
Site Admin
Joined: 10 Apr 2013
Posts: 576
|
Post: #961  Posted: Wed Dec 29, 2010 4:50 pm Post subject: Posted: Wed Dec 29, 2010 4:50 pm Post subject: |
 |
|
Dear Sumesh,
Posting personal information like email's are not allowed in the FORUM. Please go through http://www.icharts.in/forum/forum-usage-rules-und-regulations-t2771.html 
You can use the SB facility, if you want to provide your email id as long as our Moderators find it appropriate. 
Thanks & Regards
Kamal
| sumesh_sol wrote: | | Kya hua Casper bhai.. Aaj koi BTST nahin liya kya ? didn't post any chart.. boss apana no. bhejo mujhe at my id <REMOVED> would like to talk to you ... |
|
|
| Back to top |
|
 |
|
|  |
casper
Green Belt

Joined: 02 Oct 2010
Posts: 1315
|
Post: #962  Posted: Wed Dec 29, 2010 7:35 pm Post subject: Posted: Wed Dec 29, 2010 7:35 pm Post subject: |
 |
|
| sumesh_sol wrote: | | Kya hua Casper bhai.. Aaj koi BTST nahin liya kya ? didn't post any chart.. boss apana no. bhejo mujhe at my id <REMOVED> would like to talk to you ... |
no brother could not do anything
all time gone to averaging infomedia to save my skin 
will find some and post after 8.30
by da way,u changed ur image and now ur Dalhousie tour is showing?
just check it and confirm

i asked for pt sir's permissiion when i got vishy's id, infact both were in sb and he asked pt sir
but to get u in sb and then get pt sir at the same time seems to be difficult one

by da way, look at the co-incidence, today in morning post u wrote timing is an important factor and today in my trade i showed to all that what harm can a mis timing do
just i am mentioning that today's losss is more than all losses i made in whole December 
|
|
| Back to top |
|
 |
casper
Green Belt

Joined: 02 Oct 2010
Posts: 1315
|
Post: #963  Posted: Wed Dec 29, 2010 7:58 pm Post subject: Posted: Wed Dec 29, 2010 7:58 pm Post subject: |
 |
|
| newinvestor wrote: | Just a thought, Casper.
In such cases where a Stock ( that has been identified as a strong breakout candidate) has made a day high (lets say 24.50) , but now seems to be coming down to lets say 24.30, how about if we make a Limit Buy order above the previous high ( to catch the new momentum).
So, if it comes down, we can look again at the lower prices, but if it shoots up, we will be in the trade.
Maybe the stoploss here can be just below the previous high of 24.50?
Comments please.
| casper wrote: | hiii brothers and sisters of ichart.   
hv u ever seen a true idiot? a 100% pure,ISI mark -walla?
let me introduced one, i hv just experienced one and going to share my experience wid u. before that, i must tell u what was i doing till the morning
in the morning i was out, came in around 11 am . and i have seen all of the eod stocks i mentioned in my last post has gone up significantly
only infomedia, which is not covered in ichart intraday service, is still consolidating, so i made a buy order at 24.25, cmp was 24.50
i rarely make such orders and prefer to buy at cmp by market orders. still i made it
then when the price was 24.30, i just cancelled my order bcoz i was not sure about its direction. i thought it may come down at any time, so better keep off and i started searching set ups
no set up was seen, and i started chatting with friends over the net but still my eyes in the market
then suddenly infomedia broken out, it was 24.75-24.95--25-25.25- and so on, i stopped chatting, was waiting and waiting to enter on a retracement
no price seems good for entry to me, finally it made a high of 26.50. i thought "NOW OR NEVER"
made a market buy order. got a huge quantity of share at 26.75 and stock started heading south.....................................
now cmp is 25.50
i am holding it at 26.75. initially i broke into laughter, it was not stopping, then vishy was online(vishy.tns). i told him the episode and suddenly rakesh called as his ship is now in harbor. i told him and we three had a nice laughter 
then i thought it is good idea to share the episode to u in the forum, so i came here and posting all these
so u have been introduced to a pure idiot!!!!
i am sure that some of my brothers, who curse themselves for wrong timings in a otherwise good call will be happy to know that i am also no exception to them
happy trading and happy mis-timing
 |
|
hi newinvestor
really i was missing u, after a very long time u r posting
yes in order to get the second momentum, we can place a buy order above days high, even i did the same, high was 26.50 and my market order was 26.75
but that was the final days high and within seconds it started going down
for afew days i am working on market depth data, it means the best 5 buy and sell orders which are already put in the exchange by traders
generally the price where maximum buyer is present is a support.
for example 24.25 had 3500 buyer whereas other buyers were 24.30=500 aprx,24.35=100, and so on, cmp was something like 24.40/24.45 aprx
so 24.25 was my support but i did wrong as i placed order just at the support, i should have placed it above the support
when i cancelled my order, my reason was if 24.25 gets breached then i have no support, so when i was expecting support, i should be above support not on the support
bcoz if 24.25 was my order then it will only be executed after executing previous 3500 buys, that means my support would have gone by that time. so i cancelled it
it was correct as per my assumption, but the problem was the 2nd order which i placed after bo as due to heavy rally of 2.5 rupees( for a 24 rupees stock 2.5 rupees really matters!!!) there were no buyer, as buyer means support so i had no support so it was a free fall upto 25.50
i am explaining all these so that all of us can learn how to tackle such kinds of situation and if we get stuck then at least we can try to overcome it as this kinds of mistake will happen and we have to overcome it to be better traders
by da way, main mistake was i was trading a stock for which no intra chart was available and i was making an after rally entry, in fact i posted 26 as my target and i was buying above it, that too without any chart
so i made all possible mistakes in a single trade 
now, i am searching internet for any suitable strategy to take a 2nd entry if i find one then well and good or else, i will start finding one by trails and errors
|
|
| Back to top |
|
 |
mrvishal_g
White Belt

Joined: 17 Sep 2010
Posts: 89
|
Post: #964  Posted: Wed Dec 29, 2010 10:03 pm Post subject: Posted: Wed Dec 29, 2010 10:03 pm Post subject: |
 |
|
Hi Casper,
Today, i m sharing a tip given by my teacher who is a very good trader. He is generally trading in F&o for few days and some intraday. He is using only eod chart to select stocks and trade intraday also in these stock without using intraday chart.
When a stock is bullish on EOD due to any pattern or a particular candle.
Next day, if it start with gap up opening and start moving up for example it increase say 2% then
Case 1: it start falling and go down even from opening level ,but not below the previous close. or
Case 2: it was just moving within a small range 0.5% to 1%,
Just watch Weighted Average Price when the stock suddenly start trading above WAP, buy it immediately. The fact behind is the guy who made this stock bullish yesterday want to buy more quantity at lower rate, that’s why is not giving chance to increase rate very fast bcoz in that case he cant buy big qty at lower rate. When share start trading above WAP after a good consolidation, this is showing that guy is now ready to move. We can put stop loss just below the WAP(which was before moving smartly).
Opposite this if share start trading below WAP after good distribution, then we should avoid this even it was bullish on yesterday EOD chart.
In same way, we can trade bearish share also.
I see him two days only (in my online trading session). Most of time he earn good profit or in case of loss it was very small.
Hope, you people observe this and comment after few days observation.
Vishal
|
|
| Back to top |
|
 |
newinvestor
White Belt

Joined: 16 Feb 2010
Posts: 120
|
Post: #965  Posted: Wed Dec 29, 2010 10:51 pm Post subject: Posted: Wed Dec 29, 2010 10:51 pm Post subject: |
 |
|
hi newinvestor
really i was missing u, after a very long time u r posting
Thanks for remembering, Casper.
Really good job by you and Sumesh.
Not able to trade much these days due to time constraints.
[/b]
|
|
| Back to top |
|
 |
girishhu1
White Belt

Joined: 17 Aug 2009
Posts: 316
|
Post: #966  Posted: Thu Dec 30, 2010 7:33 am Post subject: Posted: Thu Dec 30, 2010 7:33 am Post subject: |
 |
|
| casper wrote: | | girishhu1 wrote: | hi casperji,
posting eod, hrly charts of essar oil & divis lab kindly offer your comments.
regards,
girish |
hi girish bhaiya
divislab has monthly pivot at 655. plz enter only above it or else it will choke
the price movements
essaroil:- we could enter around 125 depending on hourly chart
now as per eod chart,140 seems to be a resistance, we can enter if a break out happens here. then 145 will be the 1st target as weekly r2 |
hi casperji,
divis lab has monthly pivot at 640 and r1 at 676. i dont find monthly pivot of 655 on chart kindly explain.
also in case of essar oil entering at 125 is meaningless as the pattern would be null & void at that level. kindly confirm
regards.
girish
|
|
| Back to top |
|
 |
casper
Green Belt

Joined: 02 Oct 2010
Posts: 1315
|
Post: #967  Posted: Thu Dec 30, 2010 8:30 am Post subject: Posted: Thu Dec 30, 2010 8:30 am Post subject: |
 |
|
| girishhu1 wrote: | | casper wrote: | | girishhu1 wrote: | hi casperji,
posting eod, hrly charts of essar oil & divis lab kindly offer your comments.
regards,
girish |
hi girish bhaiya
divislab has monthly pivot at 655. plz enter only above it or else it will choke
the price movements
essaroil:- we could enter around 125 depending on hourly chart
now as per eod chart,140 seems to be a resistance, we can enter if a break out happens here. then 145 will be the 1st target as weekly r2 |
hi casperji,
divis lab has monthly pivot at 640 and r1 at 676. i dont find monthly pivot of 655 on chart kindly explain.
also in case of essar oil entering at 125 is meaningless as the pattern would be null & void at that level. kindly confirm
regards.
girish |
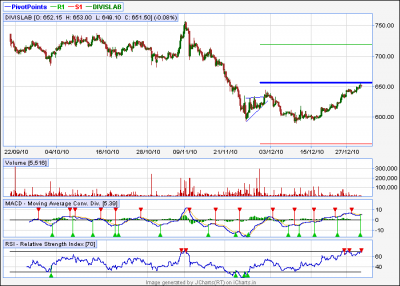
in my chart, i see divis lab has monthly pivot at 655. to be more precise its 656.47
i dont know why u r getting monthly pivot at another place, i have checked
daily and 60 min chart
both are showing pivot at this level
i am attaching the chart showing pivot, the blue line in the chart is pivot
r1 is 719 and s1 is 554, chart is of 60min tf
as per essaroil i have not said that wait up to 125 to enter. I SAID WE COULD ENTER WHEN IT WAS 125, MEANS IF WE HAD TO BUY IN PAST, THEN WE COULD BUY IT WHEN IT WAS 125, now dont enter it at 125 bcoz this will destroy the pattern, sorry for confusion 
as per current situation, enter only above 140 with added volume 
| Description: |
|
| Filesize: |
15.74 KB |
| Viewed: |
213 Time(s) |

|
|
|
| Back to top |
|
 |
casper
Green Belt

Joined: 02 Oct 2010
Posts: 1315
|
Post: #968  Posted: Thu Dec 30, 2010 8:36 am Post subject: Posted: Thu Dec 30, 2010 8:36 am Post subject: |
 |
|
| mrvishal_g wrote: | Hi Casper,
Today, i m sharing a tip given by my teacher who is a very good trader. He is generally trading in F&o for few days and some intraday. He is using only eod chart to select stocks and trade intraday also in these stock without using intraday chart.
When a stock is bullish on EOD due to any pattern or a particular candle.
Next day, if it start with gap up opening and start moving up for example it increase say 2% then
Case 1: it start falling and go down even from opening level ,but not below the previous close. or
Case 2: it was just moving within a small range 0.5% to 1%,
Just watch Weighted Average Price when the stock suddenly start trading above WAP, buy it immediately. The fact behind is the guy who made this stock bullish yesterday want to buy more quantity at lower rate, that’s why is not giving chance to increase rate very fast bcoz in that case he cant buy big qty at lower rate. When share start trading above WAP after a good consolidation, this is showing that guy is now ready to move. We can put stop loss just below the WAP(which was before moving smartly).
Opposite this if share start trading below WAP after good distribution, then we should avoid this even it was bullish on yesterday EOD chart.
In same way, we can trade bearish share also.
I see him two days only (in my online trading session). Most of time he earn good profit or in case of loss it was very small.
Hope, you people observe this and comment after few days observation.
Vishal |
hi vishal, thanks for the inputs,
infact that is the difference of having a teacher with experince and trying it on ur own 
plz explain the term weighted average price . is it WMA? plz find some time and post about it
|
|
| Back to top |
|
 |
casper
Green Belt

Joined: 02 Oct 2010
Posts: 1315
|
Post: #969  Posted: Thu Dec 30, 2010 8:42 am Post subject: Posted: Thu Dec 30, 2010 8:42 am Post subject: |
 |
|
| newinvestor wrote: | hi newinvestor
really i was missing u, after a very long time u r posting
Thanks for remembering, Casper.
Really good job by you and Sumesh.
Not able to trade much these days due to time constraints.
[/b] |
hi newinvestor
i rem all of u 
and even if i go out, still i dont forget to check forum as i always wait to hear something from u
specially i have no chance to forget some of the ichartians including u as u were most active in the forum in past
the questions u posted in past shows that not only u have read carefully my posts, but also u analysed them to apply in ur trading
and that is the purpose of my writing

|
|
| Back to top |
|
 |
newinvestor
White Belt

Joined: 16 Feb 2010
Posts: 120
|
Post: #970  Posted: Thu Dec 30, 2010 8:52 am Post subject: Posted: Thu Dec 30, 2010 8:52 am Post subject: |
 |
|
| casper wrote: | | newinvestor wrote: | hi newinvestor
really i was missing u, after a very long time u r posting
Thanks for remembering, Casper.
Really good job by you and Sumesh.
Not able to trade much these days due to time constraints.
[/b] |
hi newinvestor
i rem all of u 
and even if i go out, still i dont forget to check forum as i always wait to hear something from u
specially i have no chance to forget some of the ichartians including u as u were most active in the forum in past
the questions u posted in past shows that not only u have read carefully my posts, but also u analysed them to apply in ur trading
and that is the purpose of my writing
 |
Thanks , Casper.
Hope to get back to learning and trading in the New Year.
Definitely , your posts as well as posts from Sumesh and others in this thread as well as in other threads has given me a better understanding.
Hope the profit comes in 2011 !!!
All the best
|
|
| Back to top |
|
 |
mrvishal_g
White Belt

Joined: 17 Sep 2010
Posts: 89
|
Post: #971  Posted: Thu Dec 30, 2010 8:55 am Post subject: Posted: Thu Dec 30, 2010 8:55 am Post subject: |
 |
|
| casper wrote: | | mrvishal_g wrote: | Hi Casper,
Today, i m sharing a tip given by my teacher who is a very good trader. He is generally trading in F&o for few days and some intraday. He is using only eod chart to select stocks and trade intraday also in these stock without using intraday chart.
When a stock is bullish on EOD due to any pattern or a particular candle.
Next day, if it start with gap up opening and start moving up for example it increase say 2% then
Case 1: it start falling and go down even from opening level ,but not below the previous close. or
Case 2: it was just moving within a small range 0.5% to 1%,
Just watch Weighted Average Price when the stock suddenly start trading above WAP, buy it immediately. The fact behind is the guy who made this stock bullish yesterday want to buy more quantity at lower rate, that’s why is not giving chance to increase rate very fast bcoz in that case he cant buy big qty at lower rate. When share start trading above WAP after a good consolidation, this is showing that guy is now ready to move. We can put stop loss just below the WAP(which was before moving smartly).
Opposite this if share start trading below WAP after good distribution, then we should avoid this even it was bullish on yesterday EOD chart.
In same way, we can trade bearish share also.
I see him two days only (in my online trading session). Most of time he earn good profit or in case of loss it was very small.
Hope, you people observe this and comment after few days observation.
Vishal |
hi vishal, thanks for the inputs,
infact that is the difference of having a teacher with experince and trying it on ur own 
plz explain the term weighted average price . is it WMA? plz find some time and post about it |
Hi Casper, there is little diff in WAP & WMA. actuallly WMA include previous day trades also. while wap or average price only for current day. But you can use wma also. for your kind infomation WAP or average price is available in watch list. you can compare this with wma, i think there will be little diff. only.
Vishal
|
|
| Back to top |
|
 |
casper
Green Belt

Joined: 02 Oct 2010
Posts: 1315
|
Post: #972  Posted: Thu Dec 30, 2010 9:13 am Post subject: Posted: Thu Dec 30, 2010 9:13 am Post subject: |
 |
|
some eod charts
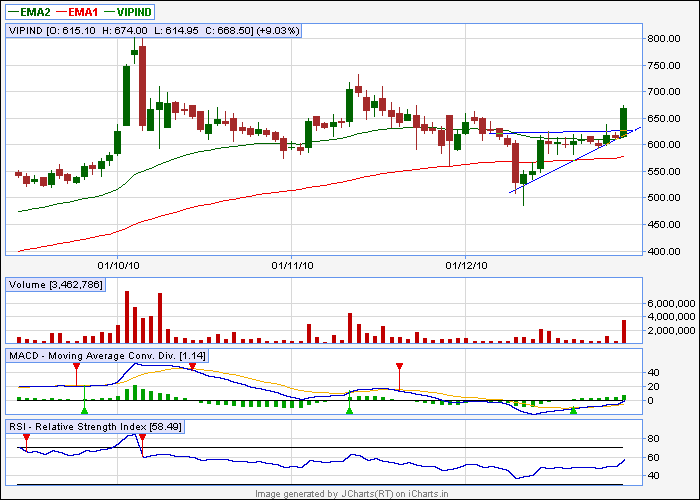
vipind= rusabh find it yesterday  , target around 700,710 , target around 700,710
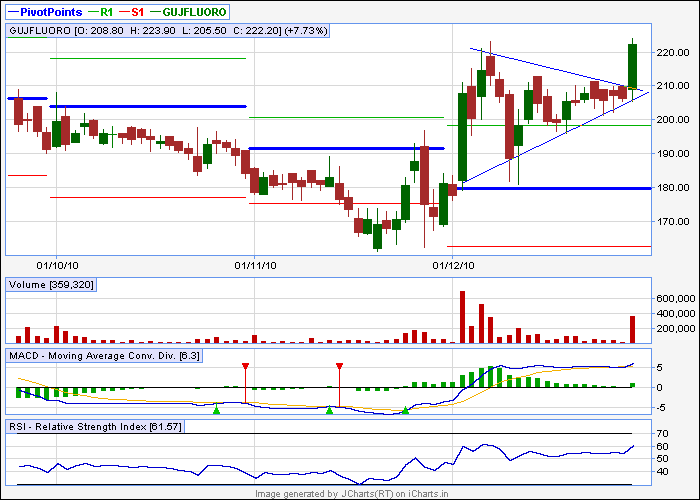
gujfluro= target 230,240
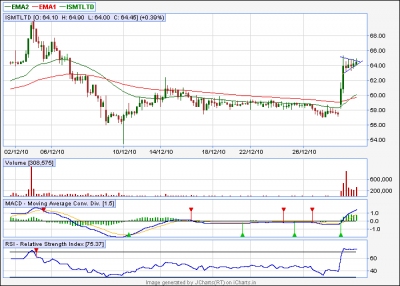
ismtltd= target 65.66
| Description: |
|
| Filesize: |
10.74 KB |
| Viewed: |
1007 Time(s) |

|
| Description: |
|
| Filesize: |
10.32 KB |
| Viewed: |
1007 Time(s) |

|
| Description: |
|
| Filesize: |
12.71 KB |
| Viewed: |
212 Time(s) |

|
|
|
| Back to top |
|
 |
sumesh_sol
Brown Belt

Joined: 06 Jun 2010
Posts: 2344
|
Post: #973  Posted: Thu Dec 30, 2010 9:48 am Post subject: Posted: Thu Dec 30, 2010 9:48 am Post subject: |
 |
|
I Booked profit in Ruchi Soya at 112.55 (2.70%) 
ABAN didn't buy (It flew by more than 3%, why didn't I buy  ) )
Dishman based on 5 minutes chart activity , placed a buy above 153.2
Autoind bought today at 214.5 , SL being 197.. will add more at 200.. Tgt 224/229..
-Sumesh
|
|
| Back to top |
|
 |
girishhu1
White Belt

Joined: 17 Aug 2009
Posts: 316
|
Post: #974  Posted: Thu Dec 30, 2010 9:49 am Post subject: Posted: Thu Dec 30, 2010 9:49 am Post subject: |
 |
|
hi casperji,
i m referring jcharts premium whereas u , it appears, referring jcharts eod hence the confusion.
regards,
girish
|
|
| Back to top |
|
 |
casper
Green Belt

Joined: 02 Oct 2010
Posts: 1315
|
Post: #975  Posted: Thu Dec 30, 2010 10:32 am Post subject: Posted: Thu Dec 30, 2010 10:32 am Post subject: |
 |
|
| sumesh_sol wrote: | I Booked profit in Ruchi Soya at 112.55 (2.70%) 
ABAN didn't buy (It flew by more than 3%, why didn't I buy  ) )
Dishman based on 5 minutes chart activity , placed a buy above 153.2
Autoind bought today at 214.5 , SL being 197.. will add more at 200.. Tgt 224/229..
-Sumesh |
brother if u hv some time, plz find my previous post about ur profile  and confirm me and confirm me
|
|
| Back to top |
|
 |
|
|
You cannot post new topics in this forum
You cannot reply to topics in this forum
You cannot edit your posts in this forum
You cannot delete your posts in this forum
You cannot vote in polls in this forum
You can attach files in this forum
You can download files in this forum
|
Powered by phpBB © 2001, 2005 phpBB Group
|
|
|

