|
|
| View previous topic :: View next topic |
| Author |
a layman's approach to break out and break down |
casper
Green Belt

Joined: 02 Oct 2010
Posts: 1315
|
Post: #1  Posted: Wed Oct 20, 2010 5:23 pm Post subject: a layman's approach to break out and break down Posted: Wed Oct 20, 2010 5:23 pm Post subject: a layman's approach to break out and break down |
 |
|
hi girishhu1, dh1988 and brothers/sisters of ichart,
at first i must apologize as i have wrote in my post that i will post my ideas about trading a break out/ break down scrip on intraday and short term basis but could not find enough time for that, so here, through this thread i will try to do the same,
the idea is not to "TEACH", bcoz i am also a student of T.A. like most of us, the idea is to "DISCUSS" which will clear doubts, (including my doubts also)
in this thread i dont want to post calls as we already have an amazing thread by CHROME where he and SUMESH along with other friends, are doing a great job,
my target is to post various theories of break out, these are not my theories, i hv learnt them thru various websites and applied successfully during my trading and now im going to share them wid u so that the new comers may use them and be benefited easily
|
|
| Back to top |
|
 |
|
| |
casper
Green Belt
Joined: 02 Oct 2010
Posts: 1315
|
| Post: #2 Posted: Wed Oct 20, 2010 5:42 pm Post subject: |
|
|
What Does Breakout Mean?
A price movement through an identified level of support or resistance, which is usually followed by HEAVY VOLUME and increased VOLATILITY. Traders will buy the underlying asset when the price breaks above a level of resistance and sell when it breaks below support.
In practice, a breakout is most commonly used to refer to a situation where the price breaks above a level of resistance and heads higher, rather than breaking below a level of support and heading lower. Once a resistance level is broken, it is regarded as the next level of support when the asset experiences a pullback
there are various types of break outs, various patterns to identify in order to trade a bo successfully, i am going to put their brief description here bcoz without knowing them its quite impossible to trade confidently
|
|
| Back to top |
|
|
casper
Green Belt
Joined: 02 Oct 2010
Posts: 1315
|
| Post: #3 Posted: Wed Oct 20, 2010 6:34 pm Post subject: |
|
|
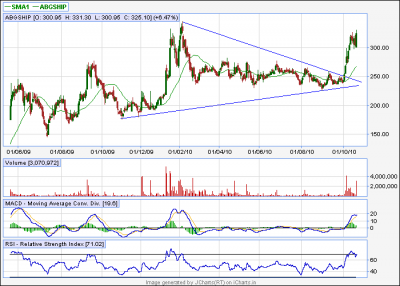
TRIANGLE
among the various patterns responsible for break outs, triangles plays an important role, its relatively easy to find out and easy to trade as generally the signals generated from these patterns are strong and dependable.
generally we have 3 kinds of triangles namely
1. symmetrical triangle
2. ascending triangle
3. descending triangle
Symmetrical Triangle (Continuation)
The symmetrical triangle, which can also be referred to as a coil, usually forms during a trend as a continuation pattern. The pattern contains at least two lower highs and two higher lows. When these points are connected, the lines converge as they are extended and the symmetrical triangle takes shape.
While there are instances when symmetrical triangles mark important trend reversals, they more often mark a continuation of the current trend. Regardless of the nature of the pattern, continuation or reversal, the direction of the next major move can only be determined after a valid breakout.
Important aspects of a symmetrical triangle
1. Trend: In order to qualify as a continuation pattern, an established trend should exist. The trend should be at least a few months old and the symmetrical triangle marks a consolidation period before continuing after the breakout.
2. Four (4) Points: At least 2 points are required to form a trend line and 2 trend lines are required to form a symmetrical triangle. Therefore, a minimum of 4 points are required to begin considering a formation as a symmetrical triangle. The second high should be lower than the first and the upper line should slope down. The second low should be higher than the first and the lower line should slope up. Ideally, the pattern will form with 6 points (3 on each side) before a breakout occurs.
3. Volume: As the symmetrical triangle extends and the trading range contracts, volume should start to diminish. This refers to the quiet before the storm, or the tightening consolidation before the breakout.
4. Duration: The symmetrical triangle can extend for a few weeks or many months. If the pattern is less than 3 weeks, it is usually considered a pennant. Typically, the time duration is about 3 months.
5. Breakout Time Frame: The ideal breakout point occurs 1/2 to 3/4 of the way through the pattern's development or time-span. The time-span of the pattern can be measured from the apex (convergence of upper and lower lines) back to the beginning of the lower trend line (base). A break before the 1/2 way point might be premature and a break too close to the apex may be insignificant. After all, as the apex approaches, a breakout must occur sometime.
6. Breakout Direction: The future direction of the breakout can only be determined after the break has occurred. Sound obvious enough, but attempting to guess the direction of the breakout can be dangerous. Even though a continuation pattern is supposed to breakout in the direction of the long-term trend, this is not always the case.
7. Breakout Confirmation: For a break to be considered valid, it should be on a closing basis. Some traders apply a price (3% break) or time (sustained for 3 days) filter to confirm validity. The breakout should occur with an expansion in volume, especially on upside breakouts.
8. Return to Apex: After the breakout (up or down), the apex can turn into future support or resistance. The price sometimes returns to the apex or a support/resistance level around the breakout before resuming in the direction of the breakout.
9. Price Target: There are two methods to estimate the extent of the move after the breakout. First, the widest distance of the symmetrical triangle can be measured and applied to the breakout point. Second, a trend line can be drawn parallel to the pattern's trend line that slopes (up or down) in the direction of the break. The extension of this line will mark a potential breakout target.
| Description: |
|
| Filesize: |
16.77 KB |
| Viewed: |
1677 Time(s) |
|
|
|
| Back to top |
|
|
ragarwal
Yellow Belt

Joined: 16 Nov 2008
Posts: 582
|
| Post: #4 Posted: Wed Oct 20, 2010 7:30 pm Post subject: |
|
|
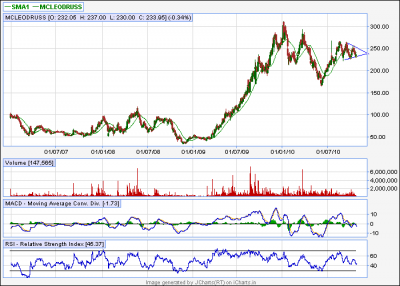
hi casper,can we see a symetrical triangle developing on mcleod russels charts,if yes what can be d breakout point and the possible targets.
rashmi
|
|
| Back to top |
|
|
DH1988
White Belt

Joined: 15 May 2007
Posts: 135
|
| Post: #5 Posted: Wed Oct 20, 2010 7:32 pm Post subject: |
|
|
 casper sir... casper sir...
|
|
| Back to top |
|
|
casper
Green Belt
Joined: 02 Oct 2010
Posts: 1315
|
| Post: #6 Posted: Wed Oct 20, 2010 8:25 pm Post subject: |
|
|
dh1988 welcome,
rashmi, a consolidated move is seen in mcleodruss from 13th sep onward,
if u refer that, then i think it will take atleast 7-12 days before it makes a perfect symmetrical triangle,
but the point is, today it closed around a support level of 232, it has to maintain the support otherwise the pattern will not complete, so i think its a long way to go,
as far as target's concern, i think the height of base is 35, so the target will be 35 + the bo
according to my "imagination" (i repeat, imagination only) the bo should occur around 240-245 level,so after a successful bo, target will be 245+35=280, but let the pattern form perfectly first 
| Description: |
|
| Filesize: |
17.38 KB |
| Viewed: |
1342 Time(s) |
|
|
|
| Back to top |
|
|
casper
Green Belt
Joined: 02 Oct 2010
Posts: 1315
|
| Post: #7 Posted: Thu Oct 21, 2010 8:07 am Post subject: |
|
|
Ascending Triangle (Continuation)
The ascending triangle is a bullish formation that usually forms during an uptrend as a continuation pattern. There are instances when ascending triangles form as reversal patterns at the end of a downtrend, but they are typically continuation patterns. Regardless of where they form, ascending triangles are bullish patterns that indicate accumulation.
Because of its shape, the pattern can also be referred to as a right-angle triangle. Two or more equal highs form a horizontal line at the top. Two or more rising bottoms form an ascending trend line that converges on the horizontal line as it rises. If both lines were extended right, the ascending trend line could act as the hypotenuse of a right triangle. If a perpendicular line were drawn extending down from the left end of the horizontal line, a right triangle would form.
IMPORTANT ASPECTS OF THE ASCENDING TRIANGLE
1. Trend: In order to qualify as a continuation pattern, an established trend should exist. However, because the ascending triangle is a bullish pattern, the length and duration of the current trend is not as important as the robustness of the formation, which is paramount.
2. Top Horizontal Line: At least 2 reaction highs are required to form the top horizontal line. The highs do not have to be exact, but they should be within reasonable proximity of each other. There should be some distance between the highs, and a reaction low between them.
3. Lower Ascending Trend Line: At least two reaction lows are required to form the lower ascending trend line. These reaction lows should be successively higher, and there should be some distance between the lows. If a more recent reaction low is equal to or less than the previous reaction low, then the ascending triangle is not valid.
4. Duration: The length of the pattern can range from a few weeks to many months with the average pattern lasting from 1-3 months.
5. Volume: As the pattern develops, volume usually contracts. When the upside breakout occurs, there should be an expansion of volume to confirm the breakout. While volume confirmation is preferred, it is not always necessary.
6. Return to Breakout: A basic tenet of technical analysis is that resistance turns into support and vice versa. When the horizontal resistance line of the ascending triangle is broken, it turns into support. Sometimes there will be a return to this support level before the move begins in earnest.
7. Target: Once the breakout has occurred, the price projection is found by measuring the widest distance of the pattern and applying it to the resistance breakout.
In contrast to the symmetrical triangle, an ascending triangle has a definitive bullish bias before the actual breakout. If you will recall, the symmetrical triangle is a neutral formation that relies on the impending breakout to dictate the direction of the next move. On the ascending triangle, the horizontal line represents overhead supply that prevents the security from moving past a certain level. It is as if a large sell order has been placed at this level and it is taking a number of weeks or months to execute, thus preventing the price from rising further. Even though the price cannot rise past this level, the reaction lows continue to rise. It is these higher lows that indicate increased buying pressure and give the ascending triangle its bullish bias.
| Description: |
|
| Filesize: |
10.28 KB |
| Viewed: |
42275 Time(s) |
|
|
|
| Back to top |
|
|
anand1234
Yellow Belt
Joined: 17 Jul 2010
Posts: 830
|
| Post: #8 Posted: Thu Oct 21, 2010 10:06 am Post subject: |
|
|
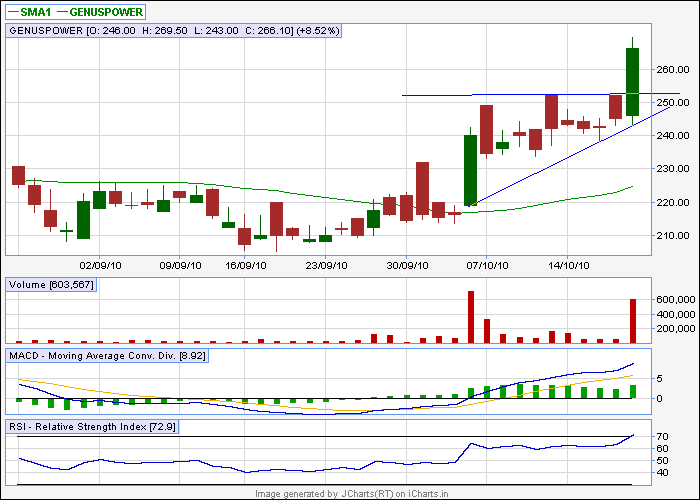
hi casper ...........can u tell me whre is the actual bo in genuspower??..............and what is the expected tgt of it?
thanks
anand
|
|
| Back to top |
|
|
newinvestor
White Belt
Joined: 16 Feb 2010
Posts: 120
|
| Post: #9 Posted: Thu Oct 21, 2010 10:16 am Post subject: Sintex |
|
|
Thanks for the discussion on breakouts.
I have read a lot about breakous failing at time, retracing and then going up again.
This may be due to operator activity to 'trap' small investors who follow the breakout line religiously.
Any thoughts on this?
Is sintex abreakout above 441?
|
|
| Back to top |
|
|
ragarwal
Yellow Belt
Joined: 16 Nov 2008
Posts: 582
|
| Post: #10 Posted: Thu Oct 21, 2010 12:12 pm Post subject: |
|
|
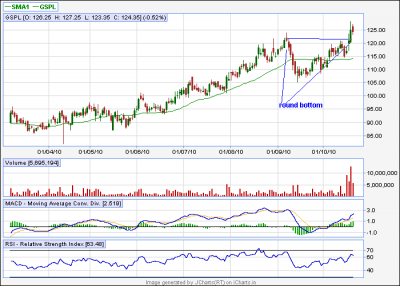
| dear casperthnx for replying in such an easy manner.gspl has boken out nd made a 52 week high.what can b the trgets nd the stoploss.
|
|
| Back to top |
|
|
casper
Green Belt
Joined: 02 Oct 2010
Posts: 1315
|
| Post: #11 Posted: Thu Oct 21, 2010 8:49 pm Post subject: |
|
|
sorry im 2 late 2 reply, ok im replying u one by one
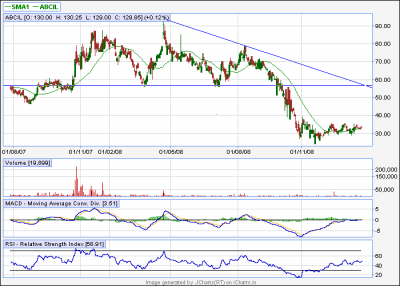
anand1234: the bo target of genus power as per my calculation, would be 275, how? plz refer that picture, u will see the lowest bottom is aprox 225 and the bo point (upper resistance) is 250,
so in order to calculate, the idea is (bo-lowest low)+bo= target
so (250-225)+250=25+250=275
so our aprox target will be 275 for the case of genus power, similarly u can measure the possible target of any triangle bo, simple, is not it?
newinvestor: yes, u r right that any green closing above 440 with good volume will be a break out, and the near term target will be 475, then u have a mid term target of 490-500, bt that is a mid term target, will take time,
and as per ur thought that price retraces, yes, absolutely, price do retrace, but then the broken resistance, which is our bo point, generally provide good support, so that is not a huge problem as i think.
and yes, operators do trap us,(thats why they r operators  ), but there are a few tricks to avoid their traps as well, i will discuss about that in due course, but before that, i feel i must complete the description of break out patterns, otherwise, it would be hard for me to explain properly, so plz bear up with me ), but there are a few tricks to avoid their traps as well, i will discuss about that in due course, but before that, i feel i must complete the description of break out patterns, otherwise, it would be hard for me to explain properly, so plz bear up with me
ragarwal: gspl made a all time high (i may b wrong also) now our target should be 130-135 for 2/3 days at the same time, we have to mainatin a stoploss of 120 by closing,( it gave a round bottom/saucer bo)
| Description: |
|
| Filesize: |
14.1 KB |
| Viewed: |
924 Time(s) |
|
|
|
| Back to top |
|
|
casper
Green Belt
Joined: 02 Oct 2010
Posts: 1315
|
| Post: #12 Posted: Thu Oct 21, 2010 9:15 pm Post subject: |
|
|
Descending Triangle (Continuation)
The descending triangle is a bearish formation that usually forms during a downtrend as a continuation pattern. There are instances when descending triangles form as reversal patterns at the end of an uptrend, but they are typically continuation patterns. Regardless of where they form, descending triangles are bearish patterns that indicate distribution.
Because of its shape, the pattern can also be referred to as a right-angle triangle. Two or more comparable lows form a horizontal line at the bottom. Two or more declining peaks form a descending trend line above that converges with the horizontal line as it descends. If both lines were extended right, the descending trend line could act as the hypotenuse of a right triangle. If a perpendicular line were drawn extending up from the left end of the horizontal line, a right triangle would form.
IMPORTANT ASPECTS
1. Trend: In order to qualify as a continuation pattern, an established trend should exist. However, because the descending triangle is definitely a bearish pattern, the length and duration of the current trend is not as important. The robustness of the formation is paramount.
2. Lower Horizontal Line: At least 2 reaction lows are required to form the lower horizontal line. The lows do not have to be exact, but should be within reasonable proximity of each other. There should be some distance separating the lows and a reaction high between them.
3. Upper Descending Trend Line: At least two reaction highs are required to form the upper descending trend line. These reaction highs should be successively lower and there should be some distance between the highs. If a more recent reaction high is equal to or greater than the previous reaction high, then the descending triangle is not valid.
4. Duration: The length of the pattern can range from a few weeks to many months, with the average pattern lasting from 1-3 months.
5. Volume: As the pattern develops, volume usually contracts. When the downside break occurs, there would ideally be an expansion of volume for confirmation. While volume confirmation is preferred, it is not always necessary.
6. Return to Breakout: A basic tenet of technical analysis is that broken support turns into resistance and visa versa. When the horizontal support line of the descending triangle is broken, it turns into resistance. Sometimes there will be a return to this newfound resistance level before the down move begins in earnest.
7. Target: Once the breakout has occurred, the price projection is found by measuring the widest distance of the pattern and subtracting it from the resistance breakout.
In contrast to the symmetrical triangle, a descending triangle has a definite bearish bias before the actual break. The symmetrical triangle is a neutral formation that relies on the impending breakout to dictate the direction of the next move. For the descending triangle, the horizontal line represents demand that prevents the security from declining past a certain level. It is as if a large buy order has been placed at this level and it is taking a number of weeks or months to execute, thus preventing the price from declining further. Even though the price does not decline past this level, the reaction highs continue to decline. It is these lower highs that indicate increased selling pressure and give the descending triangle its bearish bias.
| Description: |
|
| Filesize: |
15.03 KB |
| Viewed: |
867 Time(s) |
|
|
|
| Back to top |
|
|
mithu2
White Belt
Joined: 17 Nov 2009
Posts: 10
|
| Post: #13 Posted: Thu Oct 21, 2010 11:36 pm Post subject: rectangular brekout |
|
|
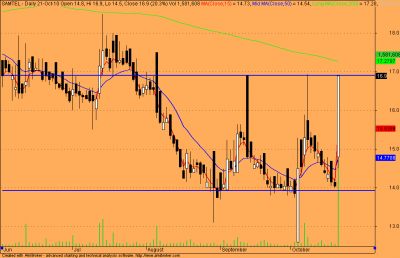
see the samtel chart, wht sud happen tomorrow ,will it breakout and cross 200 dma with volume.pls alert
| Description: |
|
| Filesize: |
14.2 KB |
| Viewed: |
801 Time(s) |
|
|
|
| Back to top |
|
|
enroute
White Belt
Joined: 01 May 2010
Posts: 64
|
| Post: #14 Posted: Fri Oct 22, 2010 12:33 am Post subject: |
|
|
| @ casper: Good work
|
|
| Back to top |
|
|
ragarwal
Yellow Belt
Joined: 16 Nov 2008
Posts: 582
|
| Post: #15 Posted: Fri Oct 22, 2010 12:48 am Post subject: |
|
|
thnx casper ur doing a fine job.plz hv a look at jocils charts.it seems to b making a rounding top pattern,i hv it at 400 levels.wil it b ok to exit.plz see cosmo films charts which is making a rounding bottom or a cup n handle in d making.if thts d case it wil soon breakout?
warm regds rashmi
|
|
| Back to top |
|
|
|
|
You cannot post new topics in this forum
You cannot reply to topics in this forum
You cannot edit your posts in this forum
You cannot delete your posts in this forum
You cannot vote in polls in this forum
You can attach files in this forum
You can download files in this forum
|
Powered by phpBB © 2001, 2005 phpBB Group
|
|
|


