| View previous topic :: View next topic |
| Author |
ABIRLANUVO |
ktpillai
White Belt

Joined: 23 Nov 2007
Posts: 95
|
Post: #1  Posted: Sun Dec 02, 2012 9:16 am Post subject: ABIRLANUVO Posted: Sun Dec 02, 2012 9:16 am Post subject: ABIRLANUVO |
 |
|
Friends,
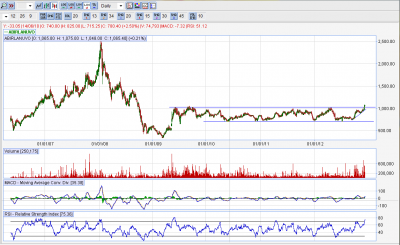
Attaching a daily chart of Abirlanuvo.The scrip has been trading in a range for the last three years.It seems the scrip has shown some movement upside by breaking out the range.Members are requested to give their views with regard to future price movement
| Description: |
|
| Filesize: |
35.5 KB |
| Viewed: |
499 Time(s) |

|
|
|
| Back to top |
|
 |
|
|  |
psalm
Black Belt

Joined: 12 Nov 2011
Posts: 5368
|
Post: #2  Posted: Sun Dec 02, 2012 11:16 am Post subject: Posted: Sun Dec 02, 2012 11:16 am Post subject: |
 |
|
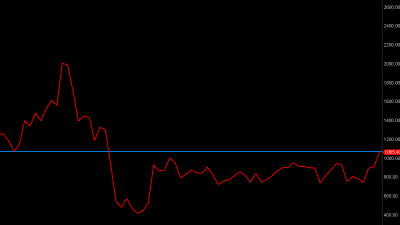
Let me take my take on that stock.  ....As per my studies, Aditya Birla Nuvo has significant resistance in the range 1025-1085 range. Now the stock is trading at the upper bands of this range. In my opinion, as long as the stock closes below 1080 levels, there wont be any sustainable upside for the stock. If you're optimistic about the overall market performance in the near future, then you may hold the stock or using tight trailing stops.. However, if you're not really optimistic about the market going up from the current levels, my suggestion will be to exit the LONGs. If you're a bit adventurous, I'll even suggest taking SHORT position in that stock at current levels or after a SELL signal. Talking about levels, the stock may test 1165 or even 1195 levels if it starts trading above 1085 levels. In that case, the stock will attract more and more buyers and hence one can expect much higher levels (even 1650 levels), I feel. However, if the stock finds it difficult break above 1085 levels on a closing basis, then there is good chance for it to test 1020 or 1000 levels. The stock will attract more and more sellers if it starts trading below 1020 levels on a sustainable basis. In that case, there is good chance of the stock testing 850 levels again with levels around 965 offering some minor support. ....As per my studies, Aditya Birla Nuvo has significant resistance in the range 1025-1085 range. Now the stock is trading at the upper bands of this range. In my opinion, as long as the stock closes below 1080 levels, there wont be any sustainable upside for the stock. If you're optimistic about the overall market performance in the near future, then you may hold the stock or using tight trailing stops.. However, if you're not really optimistic about the market going up from the current levels, my suggestion will be to exit the LONGs. If you're a bit adventurous, I'll even suggest taking SHORT position in that stock at current levels or after a SELL signal. Talking about levels, the stock may test 1165 or even 1195 levels if it starts trading above 1085 levels. In that case, the stock will attract more and more buyers and hence one can expect much higher levels (even 1650 levels), I feel. However, if the stock finds it difficult break above 1085 levels on a closing basis, then there is good chance for it to test 1020 or 1000 levels. The stock will attract more and more sellers if it starts trading below 1020 levels on a sustainable basis. In that case, there is good chance of the stock testing 850 levels again with levels around 965 offering some minor support.
NOTE: As per the monthly closing on Friday, one can see that the stock is around a key level. Posting the Monthly chart:
| Description: |
|
| Filesize: |
15.19 KB |
| Viewed: |
463 Time(s) |

|
|
|
| Back to top |
|
 |
|
|
You cannot post new topics in this forum
You cannot reply to topics in this forum
You cannot edit your posts in this forum
You cannot delete your posts in this forum
You cannot vote in polls in this forum
You can attach files in this forum
You can download files in this forum
|
Powered by phpBB © 2001, 2005 phpBB Group
|
|

