| View previous topic :: View next topic |
| Author |
Any reason for such failures |
amitkbaid1008
Yellow Belt

Joined: 04 Mar 2009
Posts: 540
|
Post: #1  Posted: Sun Dec 05, 2010 3:18 pm Post subject: Any reason for such failures Posted: Sun Dec 05, 2010 3:18 pm Post subject: Any reason for such failures |
 |
|
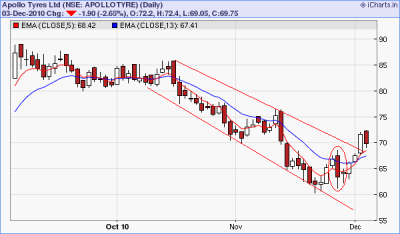
I am attaching EOD chart of APOLLOTYRE
Stock was in perfect downtrend
Then made a swing high of 76.50 and again down to 60.30 and then retraced around 50% and made high of 68.50 and this retracement completed with a big bearish engulfing candle (marked in circle)
I my opinion this was the perfect short opportunity but the trade failed miserably.
Can any one explain why???
| Description: |
|
| Filesize: |
21.41 KB |
| Viewed: |
344 Time(s) |

|
|
|
| Back to top |
|
 |
|
|  |
sherbaaz
Yellow Belt

Joined: 27 May 2009
Posts: 543
|
Post: #2  Posted: Sun Dec 05, 2010 5:02 pm Post subject: Re: Any reason for such failures Posted: Sun Dec 05, 2010 5:02 pm Post subject: Re: Any reason for such failures |
 |
|
| amitkbaid1008 wrote: | I am attaching EOD chart of APOLLOTYRE
Stock was in perfect downtrend
Then made a swing high of 76.50 and again down to 60.30 and then retraced around 50% and made high of 68.50 and this retracement completed with a big bearish engulfing candle (marked in circle)
I my opinion this was the perfect short opportunity but the trade failed miserably.
Can any one explain why??? |
Hi,
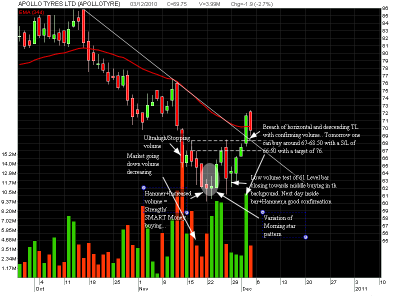
Check volume on bearish red candle although the stock was down by -5.31% but the volume was very low. Basically indicating it a trap by "SMART MONEY", there was no real supply. Also check there was a morning star pattern not to the T but a modified one which was more potent as formed at the bottom and near the support provided by 12/08/2010 candle, where as bearish engulfing pattern was not so strong.
Also for a long time the stock was trading in a channel and the bearish engulfing formed closed to the down trend line so even if consider to short the risk:reward was not favorable.
Hope this will clear your doubts.
Regards,
|
|
| Back to top |
|
 |
amitkbaid1008
Yellow Belt

Joined: 04 Mar 2009
Posts: 540
|
Post: #3  Posted: Sun Dec 05, 2010 5:54 pm Post subject: Posted: Sun Dec 05, 2010 5:54 pm Post subject: |
 |
|
Thanks Sherbaaz for your reply. I forgot the volume which is important when analyzing Candlestick Patterns. Thanks for reminding me about that.
But I could not find Morning Star Pattern in APOLLOTYRE
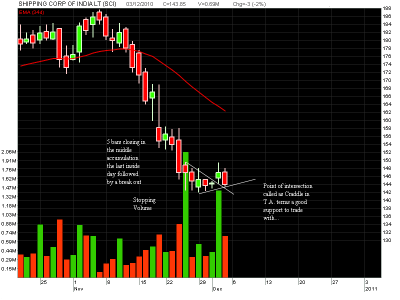
Will you please check the charts of SCI (Shipping Corporation of India). I am short here again.
Thanks in advance
(Others may also share their views about both SCI and APOLLOTYRE)
|
|
| Back to top |
|
 |
RoyalTrader
White Belt

Joined: 31 Oct 2010
Posts: 75
|
Post: #4  Posted: Sun Dec 05, 2010 10:02 pm Post subject: Posted: Sun Dec 05, 2010 10:02 pm Post subject: |
 |
|
Dear amitkbaid1008,
What sherbaaz mentioned is absolutely correct..
I would like to add to it some imp points, Kindly go through the attached charts...
Also dont remain short on SCI, instead you can buy it with a S/L 141 And target of 162, a good risk-reward bet...
Regards,
Royal
| Description: |
|
| Filesize: |
52.51 KB |
| Viewed: |
341 Time(s) |

|
| Description: |
|
| Filesize: |
38.91 KB |
| Viewed: |
356 Time(s) |

|
|
|
| Back to top |
|
 |
amitkbaid1008
Yellow Belt

Joined: 04 Mar 2009
Posts: 540
|
Post: #5  Posted: Sun Dec 05, 2010 10:48 pm Post subject: Posted: Sun Dec 05, 2010 10:48 pm Post subject: |
 |
|
RoyalTrader
Actually I am looking for perfect trend either up or down and take entries on the basis of Fibonacci Retracements.
But I think due to volatility whatever trend I identify is not correct therefore patterns & volumes becomes more important.
What you identified as Morning Star; I identified that as spinning top.
Thanks for your opinion
|
|
| Back to top |
|
 |
|
|
You cannot post new topics in this forum
You cannot reply to topics in this forum
You cannot edit your posts in this forum
You cannot delete your posts in this forum
You cannot vote in polls in this forum
You can attach files in this forum
You can download files in this forum
|
Powered by phpBB © 2001, 2005 phpBB Group
|
|

