| View previous topic :: View next topic |
| Author |
APF method |
svkum
White Belt

Joined: 14 Feb 2007
Posts: 321
|
Post: #1  Posted: Sun May 27, 2012 4:12 pm Post subject: APF method Posted: Sun May 27, 2012 4:12 pm Post subject: APF method |
 |
|
APF = andrews pitchfork method is about locating support and resistance with respect median line and upper and lower trend lines.
Median line in max times guides us the tgts .
For constructing APF , locate pivots as lower low, high, and next low
join the high and low , and draw a line through the center point of line joing high and low.
also draw parellel to median lines at high and low points
now this becomes a fig of pitch fork.
lower line will act support
median line will act as center of attraction line , upper line will act as resistance.
ITS observed that 80% of the occasions this style has success.
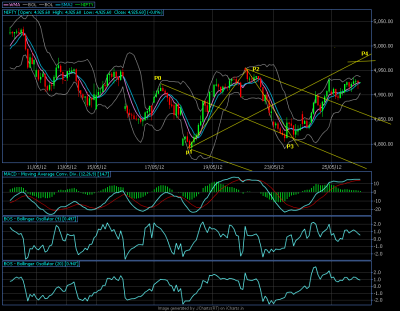
NOW attaching a chart for nifty and the pivots P0, P1,P2
WE GET P3 AS TGT
NOW DRAW a line P1,P4 THRU -P2,P3-
WE are yet to get the trend reversal, but tgt is 4968, as it looks '
this tgt may cross upperside , may reverse to lower channel line .
this chart is self expalainotery.
we can draw many big small pitchfork to arrive at possible tgts , supports , resistances
I will have many more charts to explain this criteria.
| Description: |
|
| Filesize: |
83.61 KB |
| Viewed: |
1049 Time(s) |
|
|
|
| Back to top |
|
 |
|
|
 |
jjm
White Belt

Joined: 17 Mar 2010
Posts: 411
|
Post: #2  Posted: Sun May 27, 2012 5:33 pm Post subject: Posted: Sun May 27, 2012 5:33 pm Post subject: |
 |
|
Guruvarya Pranam!!
Enclosed for academic Interest
Regards,
JJM
| Description: |
|

Download |
| Filename: |
Median lines Swing trading.doc |
| Filesize: |
227 KB |
| Downloaded: |
2540 Time(s) |
|
|
| Back to top |
|
 |
bharatpatel
White Belt

Joined: 26 Oct 2011
Posts: 401
|
Post: #3  Posted: Sun May 27, 2012 6:29 pm Post subject: hi Posted: Sun May 27, 2012 6:29 pm Post subject: hi |
 |
|
Dear JJM,
You have posted very nice details.
Pls keep posting.
|
|
| Back to top |
|
 |
svkum
White Belt

Joined: 14 Feb 2007
Posts: 321
|
Post: #4  Posted: Sun May 27, 2012 6:39 pm Post subject: Posted: Sun May 27, 2012 6:39 pm Post subject: |
 |
|
jjm - YES I WAS TO POST THIS THEORY BASED ASPECT BEFORE POSTING A CHART, BUT THOUGHT CHART WD EXPLAIN ALL.
THANKS FOR TIMELY POSTS
ARE YU SPEAKING FROM INDIA OR DUBAI ??
|
|
| Back to top |
|
 |
svkum
White Belt

Joined: 14 Feb 2007
Posts: 321
|
Post: #5  Posted: Mon May 28, 2012 9:46 am Post subject: Posted: Mon May 28, 2012 9:46 am Post subject: |
 |
|
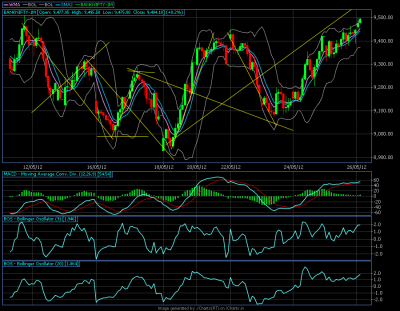
banknifty charts in 30tf
see many tgts are reached with this apf method, lower one and higher one also.
for down trend -connect higherhigh-to next majr high low link at midpoint and extend
for uptrend -connect lowerlow to next major low high link-at midpoint and extend
this method can be applied to any tf , any chart
| Description: |
|
| Filesize: |
91.98 KB |
| Viewed: |
623 Time(s) |
|
|
|
| Back to top |
|
 |
svkum
White Belt

Joined: 14 Feb 2007
Posts: 321
|
Post: #6  Posted: Mon May 28, 2012 10:30 am Post subject: Posted: Mon May 28, 2012 10:30 am Post subject: |
 |
|
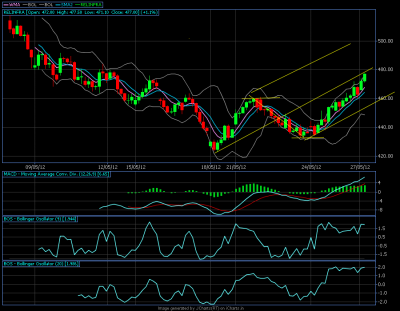
NOW LOOK AT RELINFRA CHARTS
AS PER MEDIAN LINE ,TGT IS ALMOST REACHED, MAY EXCEED , OR REVERSE.
| Description: |
|
| Filesize: |
61.3 KB |
| Viewed: |
543 Time(s) |
|
|
|
| Back to top |
|
 |
vishyvaranasi
Green Belt

Joined: 11 Jul 2011
Posts: 1159
|
Post: #7  Posted: Mon May 28, 2012 10:40 am Post subject: Hi Posted: Mon May 28, 2012 10:40 am Post subject: Hi |
 |
|
Hi SVKUm,
Can u pl. elaborate the method with a chart that hasnt reached any tgts by plotting P0,1,2. Fo ex. a chart of bank baroda.
Vishy
|
|
| Back to top |
|
 |
svkum
White Belt

Joined: 14 Feb 2007
Posts: 321
|
Post: #8  Posted: Mon May 28, 2012 11:09 am Post subject: Posted: Mon May 28, 2012 11:09 am Post subject: |
 |
|
| vishy it has abt 80% success, why pick up failed canddates , look for opportunity which will have success.
|
|
| Back to top |
|
 |
amit0666
White Belt

Joined: 23 Jun 2010
Posts: 86
|
Post: #9  Posted: Mon May 28, 2012 11:21 am Post subject: Posted: Mon May 28, 2012 11:21 am Post subject: |
 |
|
| hi svkum when to enter in trade and what is sl when enter plz explain
|
|
| Back to top |
|
 |
vishyvaranasi
Green Belt

Joined: 11 Jul 2011
Posts: 1159
|
Post: #10  Posted: Mon May 28, 2012 11:28 am Post subject: Re: Hi Posted: Mon May 28, 2012 11:28 am Post subject: Re: Hi |
 |
|
| vishyvaranasi wrote: | Hi SVKUm,
Can u pl. elaborate the method with a chart that hasnt reached any tgts by plotting P0,1,2. Fo ex. a chart of bank baroda.
Vishy |
Hi SVKUM,
What i am asking is to present a chart which is yet to start its journey towards the target. Not failed ones. Hope u got me.
Vishy
|
|
| Back to top |
|
 |
sherbaaz
Yellow Belt

Joined: 27 May 2009
Posts: 543
|
Post: #11  Posted: Mon May 28, 2012 1:01 pm Post subject: Posted: Mon May 28, 2012 1:01 pm Post subject: |
 |
|
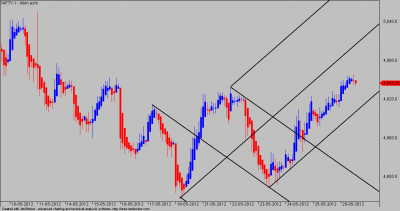
below is the chart of nifty future 30 min with pitchfork.
it has yet not touched the median line.
regds,
| Description: |
|
| Filesize: |
14.12 KB |
| Viewed: |
540 Time(s) |
|
|
|
| Back to top |
|
 |
svkum
White Belt

Joined: 14 Feb 2007
Posts: 321
|
Post: #12  Posted: Mon Jun 04, 2012 11:08 pm Post subject: Posted: Mon Jun 04, 2012 11:08 pm Post subject: |
 |
|
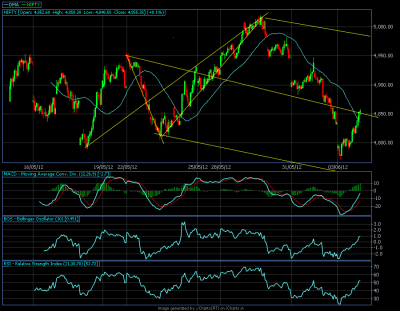
moves in both the directions are indicated .
| Description: |
|
| Filesize: |
60.02 KB |
| Viewed: |
548 Time(s) |
|
|
|
| Back to top |
|
 |
Arjun20
Yellow Belt

Joined: 23 Jun 2011
Posts: 945
|
|
| Back to top |
|
 |
svkum
White Belt

Joined: 14 Feb 2007
Posts: 321
|
Post: #14  Posted: Tue Jun 05, 2012 9:42 am Post subject: Posted: Tue Jun 05, 2012 9:42 am Post subject: |
 |
|
| yes ,it seems so.
|
|
| Back to top |
|
 |
bharatpatel
White Belt

Joined: 26 Oct 2011
Posts: 401
|
Post: #15  Posted: Tue Jun 05, 2012 11:19 am Post subject: hi Posted: Tue Jun 05, 2012 11:19 am Post subject: hi |
 |
|
Dear Svkum,
This system needs to notice the chart carefully but your BB 10 formula is super hit. Is there any modification in BB 10 ? you are not posting anything on BB 10. but anyway new guys will definately benefit from your posts on any topic.
pls keep it up
regards
|
|
| Back to top |
|
 |
|

