| View previous topic :: View next topic |
| Author |
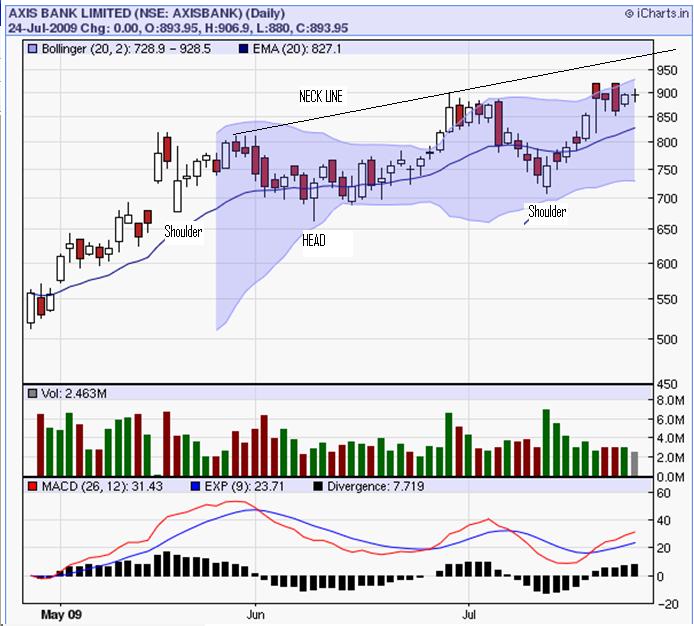
AXIS BANK invert head & shoulder |
hermish9999
White Belt

Joined: 01 Sep 2007
Posts: 9
|
Post: #1  Posted: Mon Jul 27, 2009 5:32 pm Post subject: AXIS BANK invert head & shoulder Posted: Mon Jul 27, 2009 5:32 pm Post subject: AXIS BANK invert head & shoulder |
 |
|
hi,
AXIS BANK invert head & shoulder made on WEEKLY chart.
check out chart & reply your views.
target should be 1150-1220-1325-50(medium term) SL 775.
[LINKS REMOVED BY ADMIN]
| Description: |
|
| Filesize: |
74.8 KB |
| Viewed: |
1527 Time(s) |

|
|
|
| Back to top |
|
 |
|
|  |
solanki
White Belt

Joined: 12 Feb 2007
Posts: 155
|
Post: #2  Posted: Mon Jul 27, 2009 6:23 pm Post subject: Posted: Mon Jul 27, 2009 6:23 pm Post subject: |
 |
|
| sir ji your axis bank chart is daily chart where is weekly chart?
|
|
| Back to top |
|
 |
ipakrashi
White Belt

Joined: 09 Jul 2009
Posts: 16
|
Post: #3  Posted: Mon Jul 27, 2009 8:20 pm Post subject: Axis Bank Invert Head & Shoulder Pattern Posted: Mon Jul 27, 2009 8:20 pm Post subject: Axis Bank Invert Head & Shoulder Pattern |
 |
|
hi Hesh,
your assumption is correct about the invert head and shoulder but the marking of the H&S pattern is i believe wrong. Invert H&S pattern has been formed more recently .. towards the right side of your marking, and i am not sure of the calculation of your levels, cos you have not provided any basis of that, If in case you are using fibonacci to calculate future levels, I would suggest that you read up the H&S pattern and calculate on the basis of the laid down accepted principle of calculation through chart. (You need to look up cos then only you will learn it yourself).
Regards
Neil
|
|
| Back to top |
|
 |
SwingTrader
Site Admin
Joined: 11 Aug 2006
Posts: 2903
Location: Hyderabad, India
|
Post: #4  Posted: Mon Jul 27, 2009 10:34 pm Post subject: Posted: Mon Jul 27, 2009 10:34 pm Post subject: |
 |
|
hermish9999,
Do not post links to your content / website / blog. One more violation will result in permanent ban from the forum.
_________________
Srikanth Kurdukar
@SwingTrader |
|
| Back to top |
|
 |
|
|
You cannot post new topics in this forum
You cannot reply to topics in this forum
You cannot edit your posts in this forum
You cannot delete your posts in this forum
You cannot vote in polls in this forum
You can attach files in this forum
You can download files in this forum
|
Powered by phpBB © 2001, 2005 phpBB Group
|
|

