|
|
| View previous topic :: View next topic |
| Author |
Bajaj Auto - A New Up Trend? |
PrashantSarnaik
White Belt

Joined: 02 Dec 2010
Posts: 26
|
Post: #1  Posted: Fri Sep 02, 2011 9:01 am Post subject: Bajaj Auto - A New Up Trend? Posted: Fri Sep 02, 2011 9:01 am Post subject: Bajaj Auto - A New Up Trend? |
 |
|
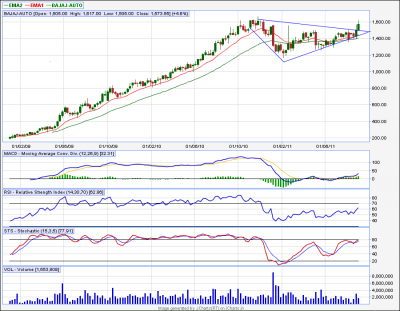
If we look at the weekly chart of Bajaj Auto, it has given a breakout from triangle (flag) on weekly chart with increased volume. I think it has started its new up trend and target should be around Rs 2800.00 in two years time. Experts welcome to comment
| Description: |
|
| Filesize: |
42.71 KB |
| Viewed: |
475 Time(s) |

|
|
|
| Back to top |
|
 |
|
|  |
singh.ravee
Yellow Belt

Joined: 12 Aug 2010
Posts: 678
|
Post: #2  Posted: Fri Sep 02, 2011 8:02 pm Post subject: Posted: Fri Sep 02, 2011 8:02 pm Post subject: |
 |
|
for me momentum indicators suggest beginning of fresh uptrend in bajaj auto.
Recent High = 1665. Close above it will confirm the news.
rgds
|
|
| Back to top |
|
 |
hasten
White Belt

Joined: 30 Jun 2011
Posts: 216
|
Post: #3  Posted: Sat Sep 03, 2011 11:06 am Post subject: Posted: Sat Sep 03, 2011 11:06 am Post subject: |
 |
|
Holding heavy long position since 1364    
|
|
| Back to top |
|
 |
casper
Green Belt

Joined: 02 Oct 2010
Posts: 1315
|
Post: #4  Posted: Sat Sep 03, 2011 12:47 pm Post subject: Re: Bajaj Auto - A New Up Trend? Posted: Sat Sep 03, 2011 12:47 pm Post subject: Re: Bajaj Auto - A New Up Trend? |
 |
|
| PrashantSarnaik wrote: | | If we look at the weekly chart of Bajaj Auto, it has given a breakout from triangle (flag) on weekly chart with increased volume. I think it has started its new up trend and target should be around Rs 2800.00 in two years time. Experts welcome to comment |
prashantji
nice attempt but a few questions, is it a flag??? or triangle? in my opinion your drawing does not resemble with either flag or triangle, i have no doubt of possibilities of up move though, if possible, try to relocate the trend lines and find a more classical version within that chart
|
|
| Back to top |
|
 |
ronypan
White Belt

Joined: 07 Aug 2010
Posts: 197
|
Post: #5  Posted: Sat Sep 03, 2011 1:24 pm Post subject: Re: Bajaj Auto - A New Up Trend? Posted: Sat Sep 03, 2011 1:24 pm Post subject: Re: Bajaj Auto - A New Up Trend? |
 |
|
| casper wrote: | | PrashantSarnaik wrote: | | If we look at the weekly chart of Bajaj Auto, it has given a breakout from triangle (flag) on weekly chart with increased volume. I think it has started its new up trend and target should be around Rs 2800.00 in two years time. Experts welcome to comment |
prashantji
nice attempt but a few questions, is it a flag??? or triangle? in my opinion your drawing does not resemble with either flag or triangle, i have no doubt of possibilities of up move though, if possible, try to relocate the trend lines and find a more classical version within that chart |
Bro.. If possible post in your way...
|
|
| Back to top |
|
 |
PrashantSarnaik
White Belt

Joined: 02 Dec 2010
Posts: 26
|
Post: #6  Posted: Sat Sep 03, 2011 3:30 pm Post subject: Re: Bajaj Auto - A New Up Trend? Posted: Sat Sep 03, 2011 3:30 pm Post subject: Re: Bajaj Auto - A New Up Trend? |
 |
|
| casper wrote: | | PrashantSarnaik wrote: | | If we look at the weekly chart of Bajaj Auto, it has given a breakout from triangle (flag) on weekly chart with increased volume. I think it has started its new up trend and target should be around Rs 2800.00 in two years time. Experts welcome to comment |
prashantji
nice attempt but a few questions, is it a flag??? or triangle? in my opinion your drawing does not resemble with either flag or triangle, i have no doubt of possibilities of up move though, if possible, try to relocate the trend lines and find a more classical version within that chart |
Dear Casperji,
As per my little knowledge a flag can be any thing a triangle, square or a flag if we can draw a pole which will hold the flag. I have drawn a triangle like this - a downward trendline from the high of Nov 2010 an upward trendline from the low of Feb 2011 and then joined these two lines i.e from Nov 2010 to Feb 2011 (high & low) Now Bajaj on weekly has given a breakout last week and closed @ 1500 i.e above the down trendline. Now the pole, it is from the lows of Dec 2008 when Bajaj stared its uptrend and never look back till Nov 2010. I arrived at two targets first is 1890 which is the width of the triangle and second target is 2800 which is the distance between flag and pole and this may take around one and half to two years. I placed a stop loss below the breakout candle i.e 1425 and it should be moved upwards as a trailing stop loss.
If above study has something missing or can be done in a better way then please let me know, because if one shares his knowledge it helps others as well
Thanks
|
|
| Back to top |
|
 |
casper
Green Belt

Joined: 02 Oct 2010
Posts: 1315
|
Post: #7  Posted: Sat Sep 03, 2011 6:22 pm Post subject: Posted: Sat Sep 03, 2011 6:22 pm Post subject: |
 |
|
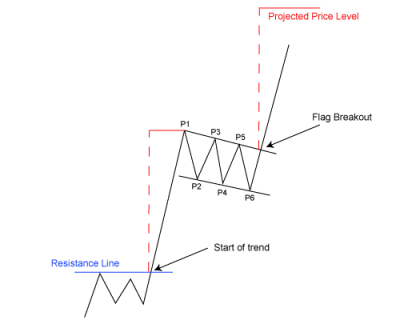
classically , a flag, [ bullish flag a we ae talking about upmove] should be like this
a strong up move with good volume, this move should be faster enough to show us almost 80-90 degree elevation....... it shows sudden buying interest of the big shots..... bcoz if u or me buy, it wont produces this kinds of move
followed by a choppy, less volume,some what decline move.... this shows that the weaker section like me and u, who bought along side the big shots, are booking profit, but there is no participation, either in buying or in selling by the big shots in this phase, thus volume is very less
then suddenly, the big shots interest is resumed and after that short span of choppy move, stock surges ahead, again with almost 80-90 degree elevation and with addition in volume, which shows that big shots are on buying spree
if u want to describe it in other simpler word, you can say, suddenly bull bought heavily, which gave us flag pole part, then power of bulls is exhausted, this generates the choppy flag part , and finally a the power of bull comes back in action, which produces the broken out part
in short, this is the psychological representation of a bullish flag, i am attaching a diagram, which i downloaded form google, im sorry, i have no time to find a "true" chart by searching all the stocks one by one, but i hope, u can guess what i want to say
moreover, i would like to tell u that i have noticed that u prefer to trade with patterns, and ur works are fairly good enough, which reminds me of my early days and makes me happy without a limit 
but i would like to suggest u that every pattern, apart from its diagram, has some psychological meaning, if you look at psychological point of view, then i hope, it will give u a better understanding of the scenario which in turns, will make u a better t.a as well as a better trader,
| Description: |
|
| Filesize: |
14.67 KB |
| Viewed: |
395 Time(s) |

|
|
|
| Back to top |
|
 |
casper
Green Belt

Joined: 02 Oct 2010
Posts: 1315
|
Post: #8  Posted: Sat Sep 03, 2011 6:28 pm Post subject: Posted: Sat Sep 03, 2011 6:28 pm Post subject: |
 |
|
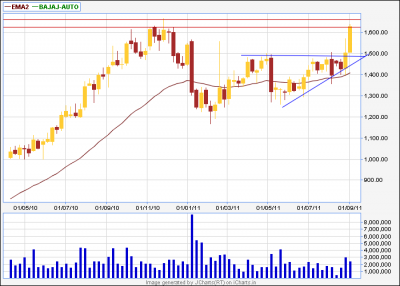
here is how i see bajaj-auto weekly chart
the upper lines in red color show the possible resistance, if it clears then no doubt a new upmove is what we can expect
| Description: |
|
| Filesize: |
15.05 KB |
| Viewed: |
386 Time(s) |

|
|
|
| Back to top |
|
 |
ronypan
White Belt

Joined: 07 Aug 2010
Posts: 197
|
Post: #9  Posted: Sat Sep 03, 2011 7:14 pm Post subject: Posted: Sat Sep 03, 2011 7:14 pm Post subject: |
 |
|
| casper wrote: | classically , a flag, [ bullish flag a we ae talking about upmove] should be like this
a strong up move with good volume, this move should be faster enough to show us almost 80-90 degree elevation....... it shows sudden buying interest of the big shots..... bcoz if u or me buy, it wont produces this kinds of move
followed by a choppy, less volume,some what decline move.... this shows that the weaker section like me and u, who bought along side the big shots, are booking profit, but there is no participation, either in buying or in selling by the big shots in this phase, thus volume is very less
then suddenly, the big shots interest is resumed and after that short span of choppy move, stock surges ahead, again with almost 80-90 degree elevation and with addition in volume, which shows that big shots are on buying spree
if u want to describe it in other simpler word, you can say, suddenly bull bought heavily, which gave us flag pole part, then power of bulls is exhausted, this generates the choppy flag part , and finally a the power of bull comes back in action, which produces the broken out part
in short, this is the psychological representation of a bullish flag, i am attaching a diagram, which i downloaded form google, im sorry, i have no time to find a "true" chart by searching all the stocks one by one, but i hope, u can guess what i want to say
moreover, i would like to tell u that i have noticed that u prefer to trade with patterns, and ur works are fairly good enough, which reminds me of my early days and makes me happy without a limit 
but i would like to suggest u that every pattern, apart from its diagram, has some psychological meaning, if you look at psychological point of view, then i hope, it will give u a better understanding of the scenario which in turns, will make u a better t.a as well as a better trader, |
Thanks
|
|
| Back to top |
|
 |
rk_a2003
Black Belt

Joined: 21 Jan 2010
Posts: 2734
|
Post: #10  Posted: Sat Sep 03, 2011 7:39 pm Post subject: Posted: Sat Sep 03, 2011 7:39 pm Post subject: |
 |
|
Thanks ronypan!
For posting this excerpt from Casper writings.
|
|
| Back to top |
|
 |
|
|
You cannot post new topics in this forum
You cannot reply to topics in this forum
You cannot edit your posts in this forum
You cannot delete your posts in this forum
You cannot vote in polls in this forum
You can attach files in this forum
You can download files in this forum
|
Powered by phpBB © 2001, 2005 phpBB Group
|
|
|

