| View previous topic :: View next topic |
| Author |
Best Tool for Charting Analysis |
rameshraja
Expert

Joined: 24 Nov 2006
Posts: 1121
|
Post: #1  Posted: Tue Feb 07, 2012 9:04 pm Post subject: Best Tool for Charting Analysis Posted: Tue Feb 07, 2012 9:04 pm Post subject: Best Tool for Charting Analysis |
 |
|
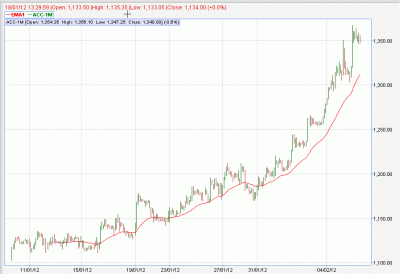
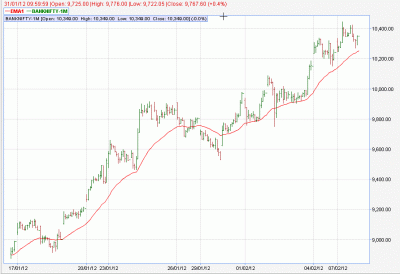
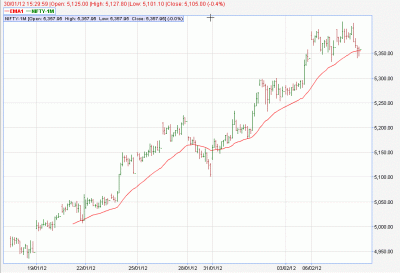
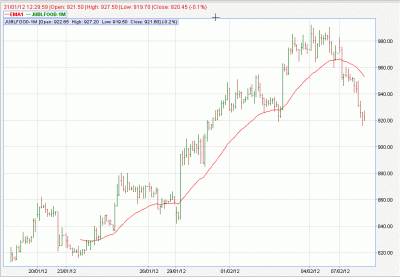
All Charting softwares have default Linear Scaling on "Y" Axis with price equally distributed. With the given Layout, one can visualise the trading opportunity as explained below.
When Nifty or a Stock advances from one level to another, one can BUY with SL on closing basis on previous level as per "Y" Axis in Scaling. Normal tendency of certain scrips to retrace to 50% level between BUY and SL and will move in the same direction. Reverse is true for Shorting.
THE BEST GIFTED TOOL FOR CHART ANALYSIS IS OUR OWN EYES AND THANK GOD FOR THIS WONDERFUL TOOL.
| Description: |
|
| Filesize: |
19.86 KB |
| Viewed: |
907 Time(s) |

|
| Description: |
|
| Filesize: |
21.66 KB |
| Viewed: |
643 Time(s) |

|
| Description: |
|
| Filesize: |
20.14 KB |
| Viewed: |
803 Time(s) |

|
|
|
| Back to top |
|
 |
|
|
 |
rameshraja
Expert

Joined: 24 Nov 2006
Posts: 1121
|
Post: #2  Posted: Tue Feb 07, 2012 9:17 pm Post subject: Posted: Tue Feb 07, 2012 9:17 pm Post subject: |
 |
|
KISS - "KEEP IT SIMPLE,STUPID"
| Description: |
|
| Filesize: |
21.85 KB |
| Viewed: |
732 Time(s) |

|
|
|
| Back to top |
|
 |
sunilhv0
White Belt

Joined: 11 Jan 2007
Posts: 5
|
Post: #3  Posted: Wed Feb 08, 2012 8:21 am Post subject: Posted: Wed Feb 08, 2012 8:21 am Post subject: |
 |
|
Dear Sir,
This is a very simple strategy which no one has noticed. But few questions i have:
1. What is the Time frame of the chart.
2. What EMA u have drawn.
3. Is this a always in trade strategy? As either Long or short must be always on.
4. And we keep trailing the trade when price closes above 1 level.
Will be grateful for clarification, so that i can use this for trading effectively.
regards,
Sunil
|
|
| Back to top |
|
 |
info
White Belt

Joined: 16 Jul 2011
Posts: 58
|
Post: #4  Posted: Wed Feb 08, 2012 8:46 am Post subject: Posted: Wed Feb 08, 2012 8:46 am Post subject: |
 |
|
I want to ask which EMA used in these chart ?
Please clarify with time frame
Thanks.
|
|
| Back to top |
|
 |
rameshraja
Expert

Joined: 24 Nov 2006
Posts: 1121
|
Post: #5  Posted: Wed Feb 08, 2012 3:16 pm Post subject: Posted: Wed Feb 08, 2012 3:16 pm Post subject: |
 |
|
See the "Y" scale for Nifty Future.. I consider that as trading level.
It declined all the way to test 5350 and never closed below that level and now bounced back to 5404. Movedup by 54 points in no time.
Simple tool to make money..
|
|
| Back to top |
|
 |
mayurnsk
Moderator
Joined: 18 Jan 2007
Posts: 216
Location: Nasik, Maharashtra
|
Post: #6  Posted: Wed Feb 08, 2012 5:24 pm Post subject: Posted: Wed Feb 08, 2012 5:24 pm Post subject: |
 |
|
Hello Sir 
Nice to see you back in the ichart & forum after long long time.... you as well as sunilhvo.

Regards
Mayurnsk
|
|
| Back to top |
|
 |
rameshraja
Expert

Joined: 24 Nov 2006
Posts: 1121
|
Post: #7  Posted: Wed Feb 08, 2012 5:58 pm Post subject: Posted: Wed Feb 08, 2012 5:58 pm Post subject: |
 |
|
Hi Mayur
Thanks.. I sent this thread link to all our old friends Sunil/ NVKS / Dr mathew and Shobby
|
|
| Back to top |
|
 |
rameshraja
Expert

Joined: 24 Nov 2006
Posts: 1121
|
Post: #8  Posted: Wed Feb 08, 2012 6:10 pm Post subject: Posted: Wed Feb 08, 2012 6:10 pm Post subject: |
 |
|
Hello Info / Sunil
The Charts are 30 Minutes Time Frame with 34 EMA. Keep Trailing the Stop when it moves from one level to another.
Always keep Simple techniques in trading.
Soon, I will show you all how Fib & Gann vibrates in market. I have made slight adjustment to Gann numbers.
|
|
| Back to top |
|
 |
dracula
White Belt

Joined: 07 Dec 2011
Posts: 31
|
Post: #9  Posted: Wed Feb 08, 2012 6:28 pm Post subject: Posted: Wed Feb 08, 2012 6:28 pm Post subject: |
 |
|
Hello sir,
It's like a sweet Melody in a distorted atmosphere... Feeling Lucky to share this platform with seniors like you, who are having time tested experience in this market...Thanks for sparing your valueable time for us.
Warm regards
Manav chowdhary
|
|
| Back to top |
|
 |
mayurnsk
Moderator
Joined: 18 Jan 2007
Posts: 216
Location: Nasik, Maharashtra
|
Post: #10  Posted: Wed Feb 08, 2012 7:12 pm Post subject: Posted: Wed Feb 08, 2012 7:12 pm Post subject: |
 |
|
Rameshraja Sir!!
hope to see those all fellas back in action once again.
Regards
Mayurnsk
|
|
| Back to top |
|
 |
drsmathew
White Belt

Joined: 29 Oct 2006
Posts: 1
|
Post: #11  Posted: Wed Feb 08, 2012 7:25 pm Post subject: Posted: Wed Feb 08, 2012 7:25 pm Post subject: |
 |
|
hello sir
nice to see you in icharts after a long time,the beauty about you is that you are an eternal innovator of trading systems,yet again you have come up with a simple and effective tool,while people chase complex systems. Brings back memories of good old days of health educative session and intresting interactions at shout box during its early days, keep up the good work sir and god bless you,
regards,
drsmathew
|
|
| Back to top |
|
 |
ProTrader
Site Admin

Joined: 06 Jul 2008
Posts: 433
|
Post: #12  Posted: Wed Feb 08, 2012 9:16 pm Post subject: Posted: Wed Feb 08, 2012 9:16 pm Post subject: |
 |
|
Knowledge should always flow like a river and quench the thirst of travellers on the way. Some travellers do pollute by throwing plastic and stones. But the river keeps flowing and quenching thirst.
I think the sessions can still happen.
Bring back those old good days.. 
Regards,
ProTrader
|
|
| Back to top |
|
 |
rk_a2003
Black Belt

Joined: 21 Jan 2010
Posts: 2734
|
Post: #13  Posted: Wed Feb 08, 2012 9:47 pm Post subject: Posted: Wed Feb 08, 2012 9:47 pm Post subject: |
 |
|
| rameshraja wrote: | Hello Info / Sunil
The Charts are 30 Minutes Time Frame with 34 EMA. Keep Trailing the Stop when it moves from one level to another.
Always keep Simple techniques in trading.
Soon, I will show you all how Fib & Gann vibrates in market. I have made slight adjustment to Gann numbers. |
Mr.RR
Thanks!It works well in trending Markets. KISS is a nice strategy simply stupendous in trending Markets.
One cannot imagine anything simpler than it, yet effective.
What about range bound markets? One may experience frequent whipsaws thus draw down too.
|
|
| Back to top |
|
 |
rameshraja
Expert

Joined: 24 Nov 2006
Posts: 1121
|
Post: #14  Posted: Wed Feb 08, 2012 9:47 pm Post subject: Posted: Wed Feb 08, 2012 9:47 pm Post subject: |
 |
|
Hello Mr Manish Agarwal
Thanks 
|
|
| Back to top |
|
 |
rameshraja
Expert

Joined: 24 Nov 2006
Posts: 1121
|
Post: #15  Posted: Wed Feb 08, 2012 9:50 pm Post subject: Posted: Wed Feb 08, 2012 9:50 pm Post subject: |
 |
|
Mr RK
In sideways market, no technical tool will work efficiently and this is not going to be an exception.
|
|
| Back to top |
|
 |
|

